|
|

|
Introduction |

|

|

|

|

|

|
|
|
Introduction |
|
|
|

|

|
|
Introduction
|
|
|
Introduction |
|
|
|
|
|
|
|
|
Introduction |
|
|
|
|
|
|
Decision-Making Information Solutions
-- analyzing demographic-economic trends and patterns
| Decision-Making Information | |
|
Contact Proximity for information resources and solutions ... (888) DMI-SOLN (888) 364-7656 |
This document provides an overview and resource reference for Proximity tools and data resources that you can use to analyze demographic trends and patterns in the San Diego, CA area and southern California region. Put these resources into action .... a few examples of uses ...
| • | Knit together characteristics of schools and school districts. |
| • | Geocode address data; add geocoded data to projects. |
| • | View road/street segments in context of any geography. |
| • | Site analysis of census block demographics; census blocks and neighborhood. |
| • | Relating city/places to school districts. |
| • | Examine what ACS 05-07 school district special tabulation demographic updates reveal about school districts of interest. |
| • | Use site analysis to examine trade/service/neighborhood areas using address-level and tax parcel data. |
| • | Analyzing patterns of percent high school graduates by census tract. |
| • | Examine the employment situation monthly updates with projections through 2010. |
| • | Assess the impact of county level projections by single year of age by gender and race/ethnicity projections to 2020. |
| • | Examine K-12 education patterns by congressional districts (and other areas). |
Using this Document
Use buttons located at upper right of screen to ... navigate among topics, view topic directory, print a topic, send feedback to Proximity on a topic, and auto expand/contract toggles for a topic/page. A PDF version of this document is available.
This document is frequently updated. Please check back.
The following sections provide examples of using the CV SiteAnalysis resources:
| • | The Regional Analysis section shows how site analysis can be used to analyze selected county groupings within a region. |
| • | The Block Group Analysis section shows how site analysis can be used to analyze block group areas and automatically generate a Demographic Comparative Analysis report for the block group selections -- component areas and a summary for selected areas |
What's Happening in San Diego?
This document provides illustrative examples and documentation for using CV geodemographic-economic analysis for a range of applications. Knit your data together with these resources to get answers to questions ... and facilitate development and access to decision-making information solutions:
| • | Join us in a Webinar -- Analyzing GeoDemographic-Economic Characteristics and Trends: San Diego |
| • | Join us in a 1-day workshop -- Analyzing GeoDemographic-Economic Characteristics and Trends: San Diego |
| • | Use the continuously updated San Diego CV project and related datasets. |
An Example ... Using Site Analysis in the La Jolla, CA Area
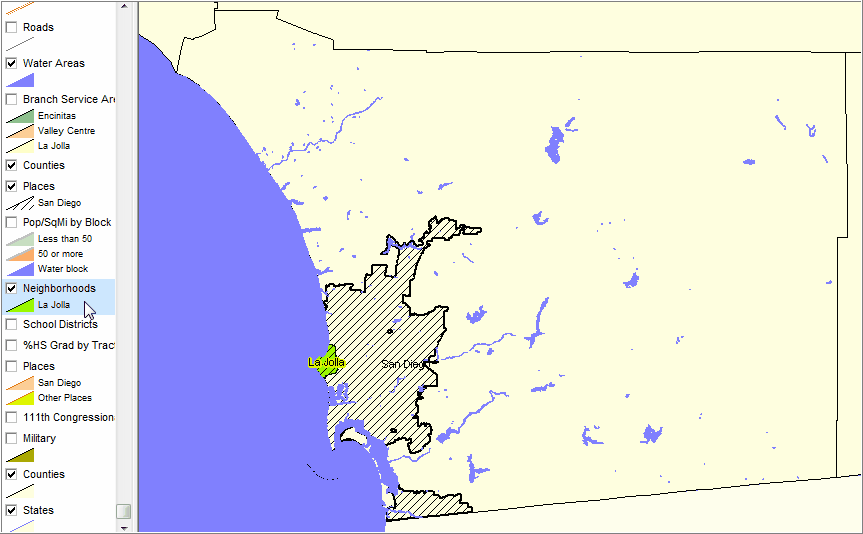
 The example shown in this section reviews basic Site Analysis operations. These operations make use of a CV GIS project focused on the San Diego, CA area. The project includes a shapefile/layer comprised of addresses/locations represented as red and blue markers. These addresses could be students, clients, alumni, association members, etc. Red markers represent Type 1 addresses (e.g., students attending school 1 or clients of type 1) ; blue markers represent Type 2 addresses (e.g., students attending school 2 or clients of type 2). See the project description for more details about layers/shapefiles and content included in the project. Visuals/examples in this section provide an overview to both how to use the operations and how information and insights are developed resulting from the site analyses.
La Jolla section (green) of San Diego city (hatch pattern) in context of San Diego County, CA
|
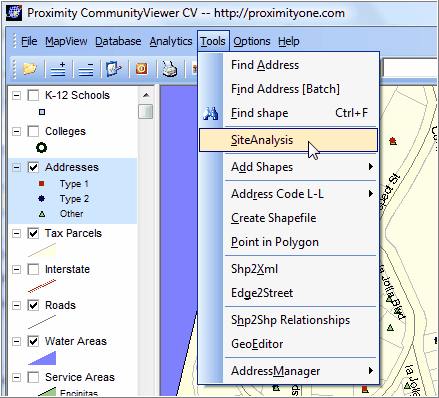
To use the CV SiteAnalysis operation, a project containing the relevant set of layers/shapefiles is opened. SiteAnalysis is started from Tools>SiteAnalysis as shown below.
|
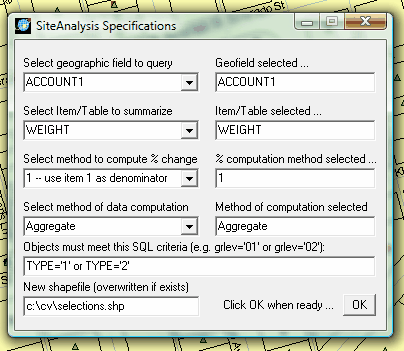
When SiteAnalysis is started, the SiteAnalysis Specifications form appears. The specifications provided in this example include:
Select geographic field to query ... set as the field ACCOUNT1 in the addresses layer Select Item/Table to summarize ... set as the field WEIGHT in the addresses layer (WEIGHT has a value of 1, so this site analysis will be to count the number of addresses in a certain area) Set Filter/Query criteria -- Objects must meet this SQL criteria ... type='1' or type='2' (addresses with a TYPE field value of 1 or 2 are of interest in the immediate analysis; this restricts selection to only these addresses)
with settings as shown above, the OK button is clicked.
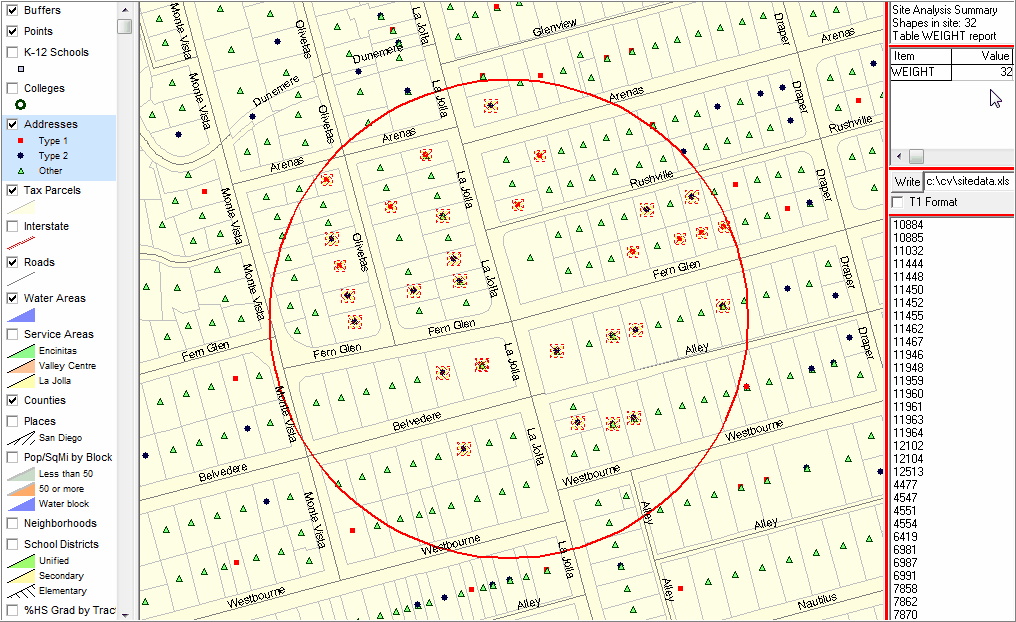
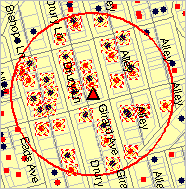
An initial 0.1 mile radius selection is made using the radius center/starting point/ a one location. This could be an existing school or business location, a prospective new location being analyzed, a bus stop, etc. The next view shows the results.
|
Site analysis in La Jolla area ... this view shows the active layer, addresses, highlighted in the legend panel (blue). Starting at the location depicted by the red triangle marker, the selection circle is dragged to the 0.1 mile radius. Upon releasing the mouse key, selected addresses are highlighted with cross-hatching. The address count within the selection area is shown as 32 in the upper right panel. The list of addresses by the value of the ACCOUNT1 file name is shown in the lower right panel. The list of addresses may be optionally exported to an Excel file by using the Write button in the left center panel. Note that no green address markers are selected/counted due to the SQL criteria in the specifications form.
|
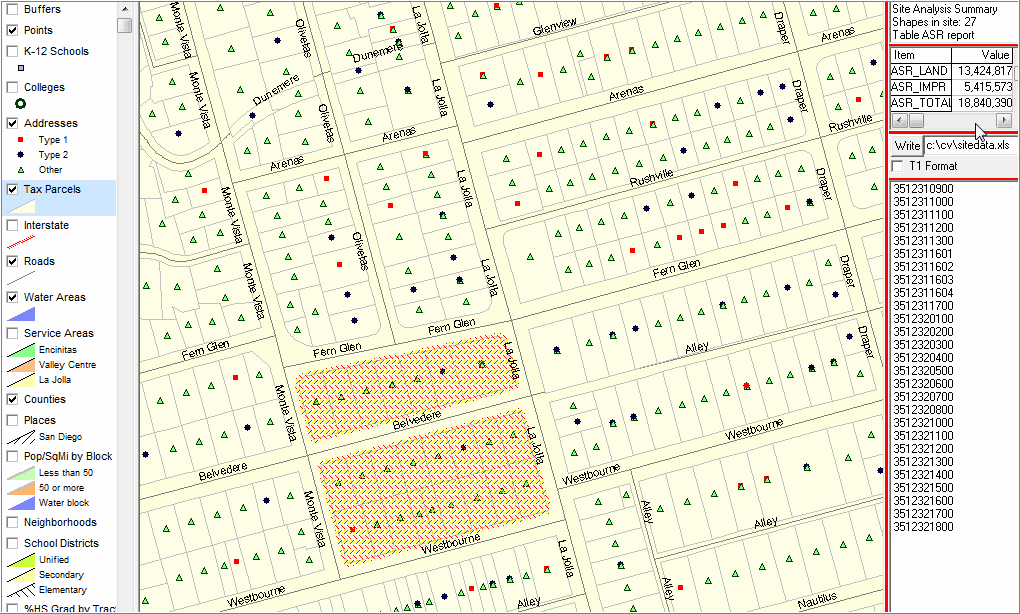
Site analysis in La Jolla area ... this view shows the active layer, tax parcels, highlighted in the legend panel (blue). A set of specific parcels are selected. Selected parcels are highlighted with cross-hatching. Rather than a count, as shown above, assessor values (ASR) are aggregated for the parcels. The tax parcel count is shown as 27 in the upper right panel. The assessment land value for the combined properties is shown as $13,424,817. The list of parcels by parcel number is shown in the lower right panel. The list of parcels may be optionally exported to an Excel file by using the Write button in the left center panel.
|
Additional Information
Proximity develops custom demographic-economic estimates and projections, geographic and geocoded data, and assists clients with use of these and related data to facilitate decision-making information solutions. Wide-ranging organizations use Proximity resources (software, data, methodologies, consulting services) to knit together and use diverse data in a decision-making and analytical framework. The Proximity CommunityViewer GIS and related resources play an important role in meeting these needs. We blend software, geographic data, and subject matter data to best meet public and private sector client needs.
11/23/2009
© 2009 ProximityOne