|
|

|
Regional Analysis |

|

|

|

|

|

|
|
|
Regional Analysis |
|
|
|

|

|
|
Regional Analysis
|
|
|
Regional Analysis |
|
|
|
|
|
|
|
|
Regional Analysis |
|
|
|
|
|
|
| Decision-Making Information | |
|
Contact Proximity for information resources and solutions ... (888) DMI-SOLN (888) 364-7656 |
Los Angeles-Long Beach-Riverside, CA CSA Application Area
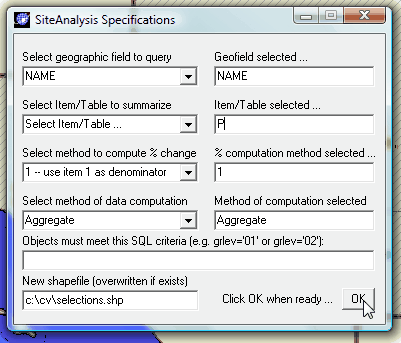
In this example, counties are used as the elemental unit for the site analysis. The Los Angeles-Long Beach-Riverside, CA CSA 5 county area in combination with San Diego County. County names and MSA names are shown as labels. Tools>Site Analysis is started and the SiteAnalysis Specifications form appears.
Select geographic field to query is set to the field NAME. Select Item/Table to summarize is set to P (setting a partial field name will result in the aggregation/display of all fields starting with those characters) No other settings are made on this form; Click OK.
|
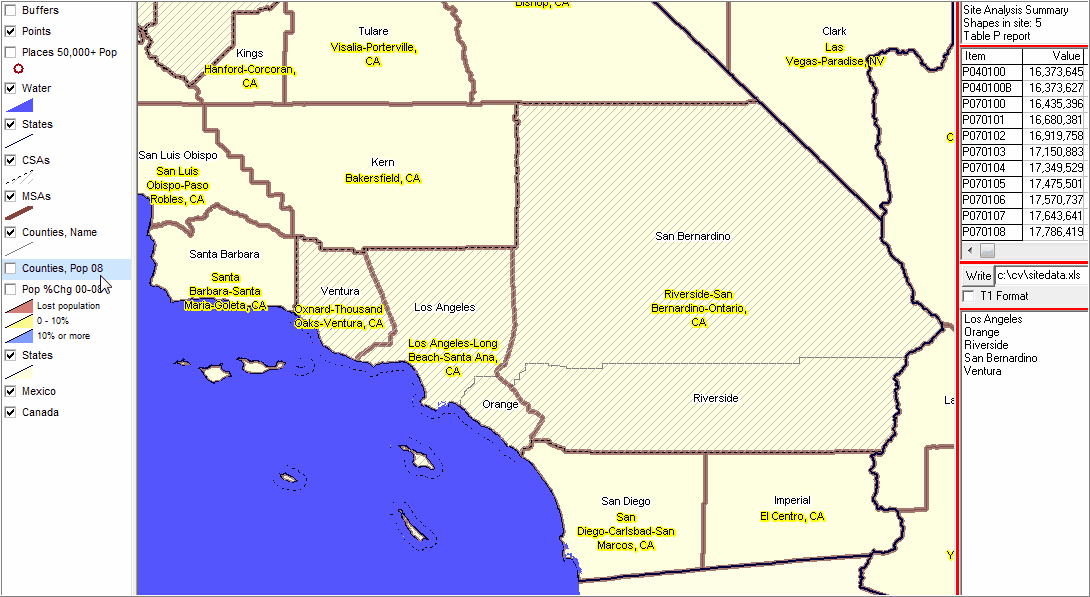
The map view appears with a prompt to select geographic objects (in this case the objects are areas -- counties) The user can select one group or any number, one at a time or as a set as shown in the next form. When the radius tool is used over a broad area, all geographic objects touches are selected. This view shows that all 5 Los Angeles-Long Beach-Riverside, CA CSA county components are selected. All "P" field name values are aggregated for the selected counties. The dynamically computed values are displayed in the upper right grid. County names are displayed in the lower right panel since the field name NAME was selected.
|
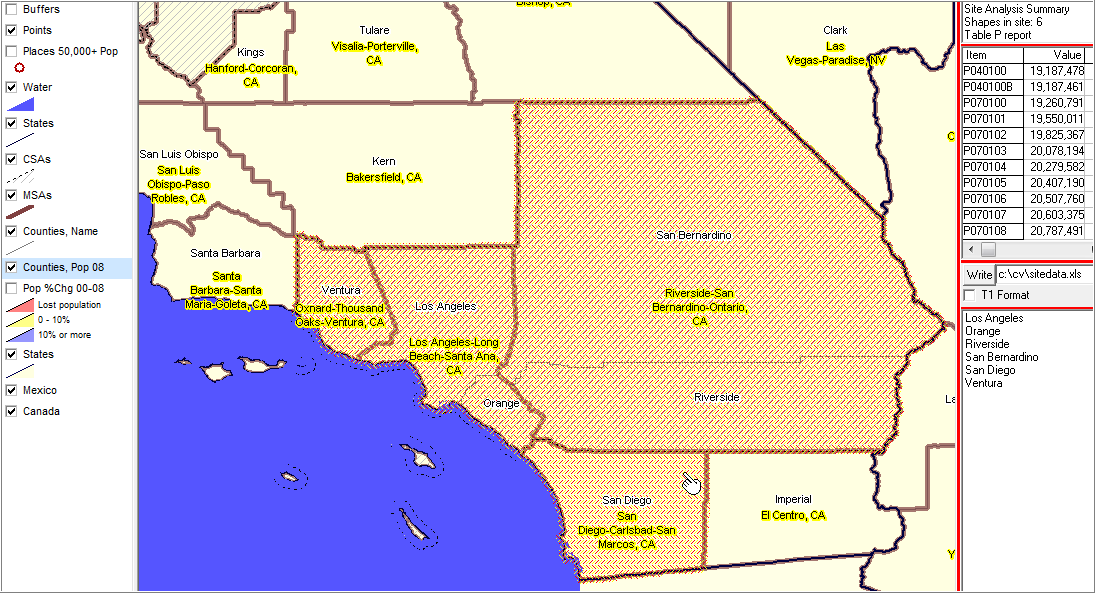
Any variation/mix of counties can be selected. As shown in the next display, San Diego County is added to the previous selection and the summary values (upper right) dynamically computed.
This application happens to be shown for southern California counties/metros, but any set of counties can be selected. The map display can simply be dragged to another state/regional and the same operations can be used.
|
Save the Summary Results to Spreadsheet
By setting the preferred file name at right in mid panel and then clicking the Write button, the summary values displayed in the upper right grid will be written to that Excel file.