Examining Metro Dynamics

Contents
In this section, you will learn to examine a specific CBSA (Core-Based Statistical Areas: metros, MSAs and MISAs) using iVDA with the "Base" project. Metro Dynamics refers to the metro geographic, demographic and economic composition and how they are changing. We will use the 2023 vintage CBSAs. See related interactive table.
iVDA is one part of a broader VDA GIS resource framework. See more about VDA GIS.
In the iVDA frame below, proceed as follows:
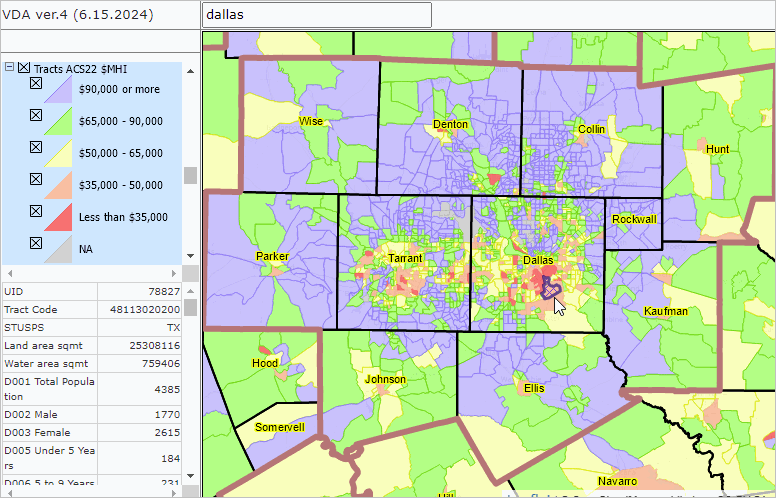
Next, we focus on a metro of interest; maybe the Dallas metro as an example.
In the searchbar, key in "Dallas, TX" and press enter (no quotes, not case sensitive)
.. the map refreshes showing a zoom-in to the Dallas, TX area
In the Legend Panel at the left of the Map Window, scroll down to "CBSA/MSA 2023" layer and check on.
.. the map refreshes showing the Dallas MSA boundary (bold)
Check on these layers:
.. "Counties Bold"
.. "County Name"
.. "Tracts ACS22 $MHI"
The map view now shows patterns of economic prosperity (median household income) by census tract for the Dallas, TX MSA.
.. using data from the American Community Survey 2022 (ACS2022)
View a demographic-economic profile for any selected tract:
.. click on a tract the map (see pointer in example below); the lower left panel profile updates.
.. a demographic profile for that tract is displayed in the lower left.
.. here you can examine a wide range of demographic subject matter items.
Visual Data Analytics Web GIS
iVDA is presented below in an interactive mapping window .. watch video
Below is a static graphic example of using iVDA as described above.