State Economic Trends
Per Capita Personal Income (PCPI) is arguably the best single measure of personal economic well-being. PCPI is estimated quarterly and annually by the Bureau of Economic Analysis. The PCPI is a part of the Regional Economic Information System (REIS) providing much more economic detail. The state quarterly PCPI time series is available using the VDAGIS "US1" project. Updated quarterly, the state PCPI has only a 2 month lag from the reference quarter to the quarter of availability/access. The VDAGIS US1 project is updated quarterly as new/revised data become available.
See related State Personal Income web section interactive table.
In this section, you will learn about examining state PCPI using iVDA with the "US1" project.
We will examine the latest state PCPI percent change from 2023Q1 to 2024Q1.
iVDA is one part of a broader VDA GIS resource framework. See more about VDA GIS.
In the iVDA frame below, proceed as follows:
In the Legend Panel at the left of the Map Window, check on these three layers:
.. State Name
.. State PCPI %Chg 23Q1-2024Q1 (label for map view)
.. State PCPI %Chg 23Q1-2024Q1 (thematic pattern map view) .. click + to left of name to view intervals
Click the globe icon below the map to zoom to lower 48 states.
The map view refreshes to show a thematic pattern view of the State PCPI %Chg 23Q1-24Q1.
Click a state of interest in the map
.. an economic-demographic profile for that state is displayed in the lower left.
.. examine many subject matter items for any state.
Visual Data Analytics Web GIS
iVDA is presented below in an interactive mapping window .. watch video
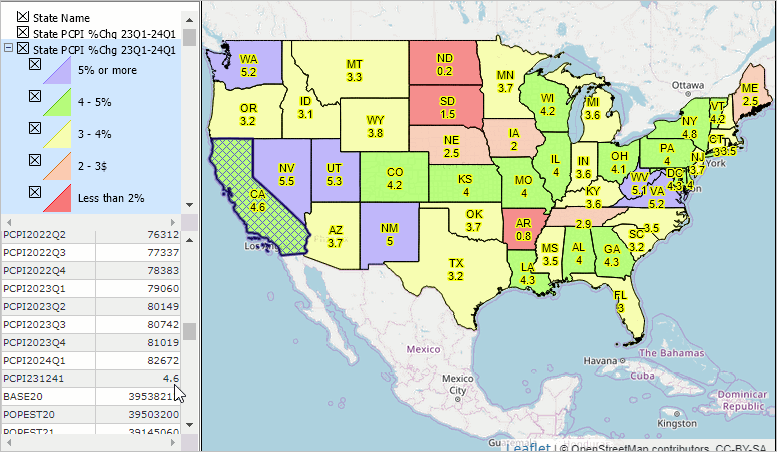
Below is a static graphic example of using iVDA as described above.
In this example, the state of California was clicked/selected.
In the lower left profile, see that PCPI changed from $79,060 (2023Q1) to $82,672 (2024Q1), change of 4%.
The US1 project enables comparison of different geography and subject matter.

