Gunnison-Pitkin

Contents
Selected CommunityViewer project/application views in Colorado.
Click toggle in Table of Contents at left to view sub-state applications.
Integrating Census 2010 TIGER Shapefiles, ACS 2009 5-year demographics, Census 2010 demographics and related data.
See related interactive ranking tables:
| • | Colorado school district demographics: http://proximityone.com/sd_co.htm. |
| • | Colorado census tract demographics: http://proximityone.com/ustr0509_co.htm. |
| • | Census 2010 demographics: http://proximityone.com/cen2010_pl94171.htm |
(all US geography: state, congressional district, county, school district, city/place, metro)
The table presented below provides a summary demographic profile for the county based on the Census 2010 P.L. 94-171 data. Similar to a profile developed by Census, this profile also includes two columns providing characteristics for the population under 18 years of age. These profiles are available for any Census 2010 geography, census block and higher level geography.
ProximityOne -- additional details and interactive ranking table
|
||||||||||||||||||||||||||||||||||||||||||||||||||||||||||||||||||||||||||||||||||||||||||||||||||||||||||||||||||||||||||||||||||||||||||||||||||||||||||||||||||||||||||||||||||||||||||||||||||||||||||
The table presented below provides a summary demographic profile for the city based on the Census 2010 P.L. 94-171 data. Similar to a profile developed by Census, this profile also includes two columns providing characteristics for the population under 18 years of age. These profiles are available for any Census 2010 geography, census block and higher level geography.
ProximityOne -- additional details and interactive ranking table
|
||||||||||||||||||||||||||||||||||||||||||||||||||||||||||||||||||||||||||||||||||||||||||||||||||||||||||||||||||||||||||||||||||||||||||||||||||||||||||||||||||||||||||||||||||||||||||||||||||||||||||
The table presented below provides a summary demographic profile for the district based on the Census 2010 P.L. 94-171 data. Similar to a profile developed by Census, this profile also includes two columns providing characteristics for the population under 18 years of age. These profiles are available for any Census 2010 geography, census block and higher level geography.
ProximityOne -- additional details and interactive ranking table
|
||||||||||||||||||||||||||||||||||||||||||||||||||||||||||||||||||||||||||||||||||||||||||||||||||||||||||||||||||||||||||||||||||||||||||||||||||||||||||||||||||||||||||||||||||||||||||||||||||||||||||
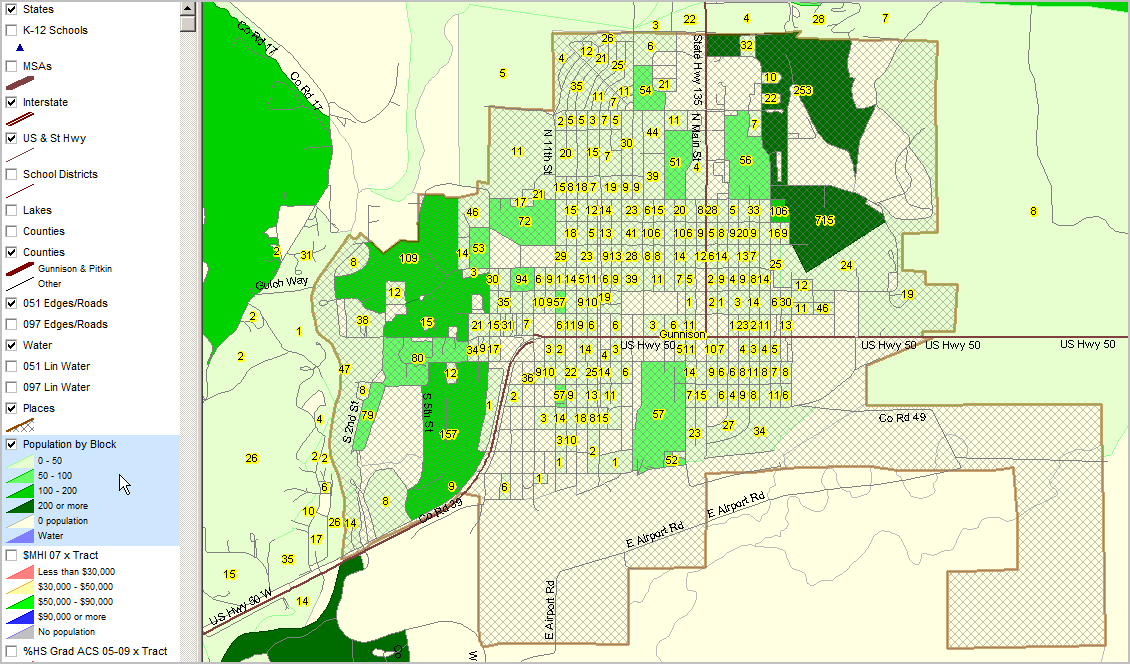
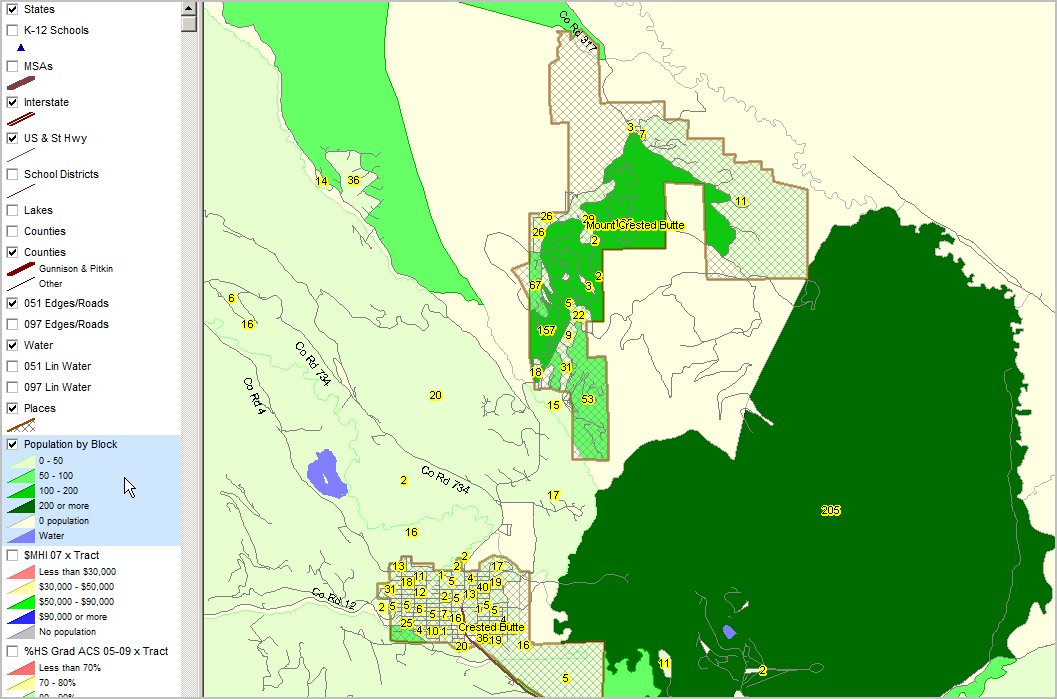
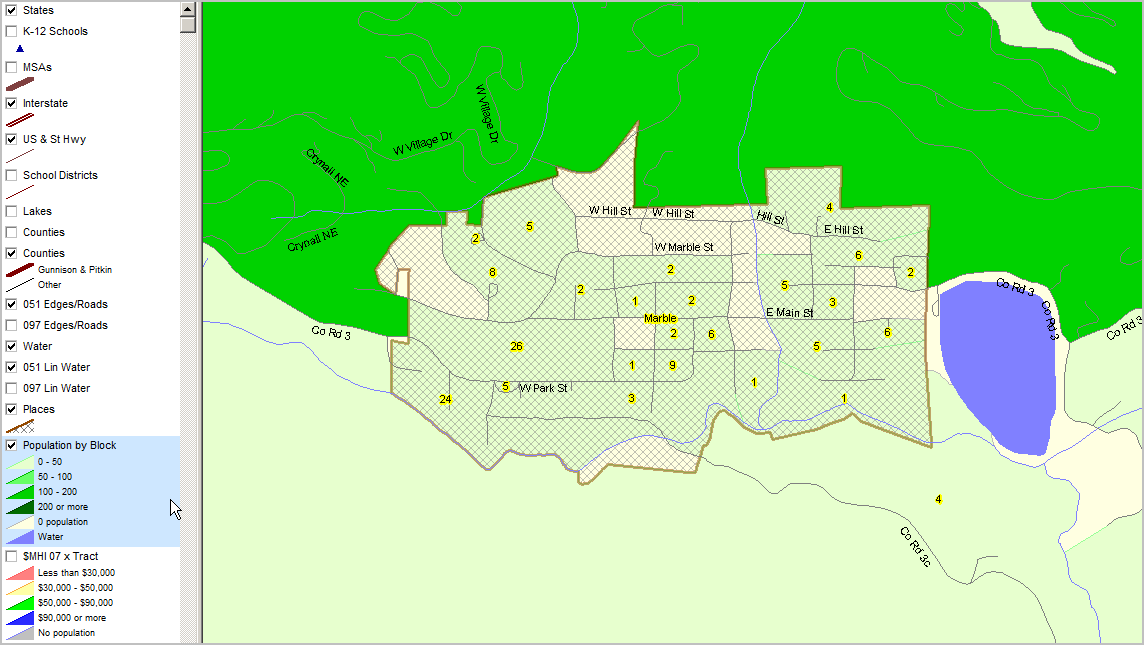
The GIS project fileset used to develop the views shown below is available for your use. Add your own data; create alternative views. We can also provide custom map views or analyses to meet your needs. Contact us for details (888-364-7656).
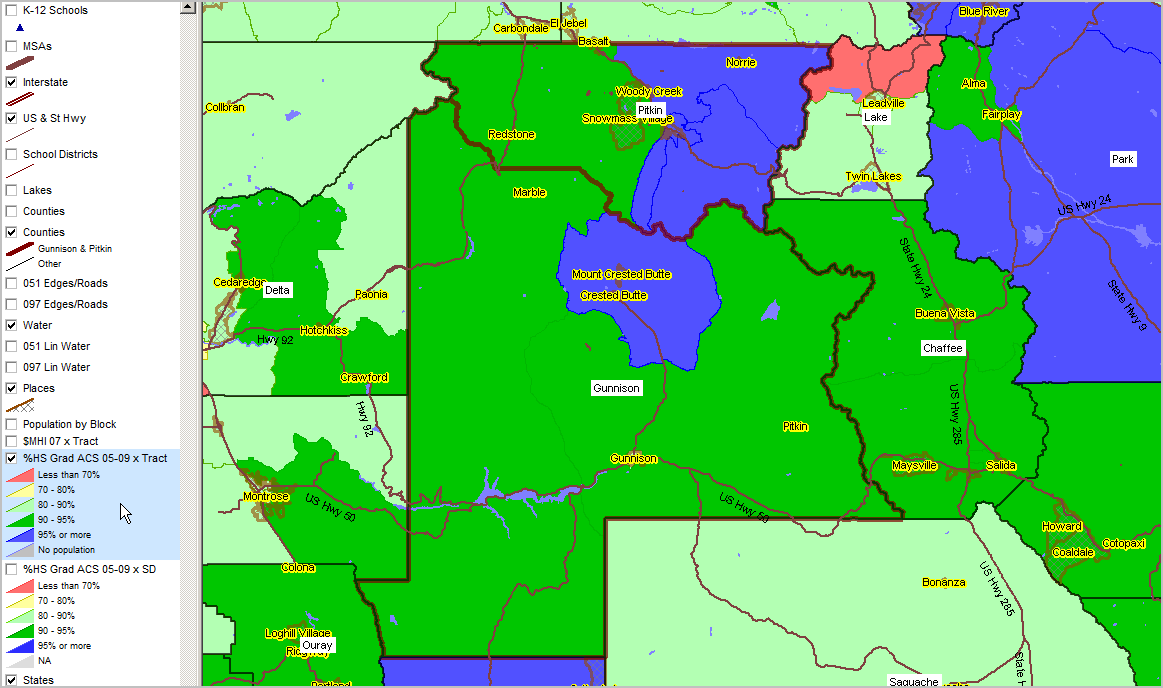
Educational Attainment by Census Tract Percent high school graduate (population 25 years and over) by census tract. Data based on 2009 American Community Survey (http://proximityone.com/acs.htm) 5-year estimates, centric to mid-2007. See color patterns in highlighted layer in legend at left of map view.
|
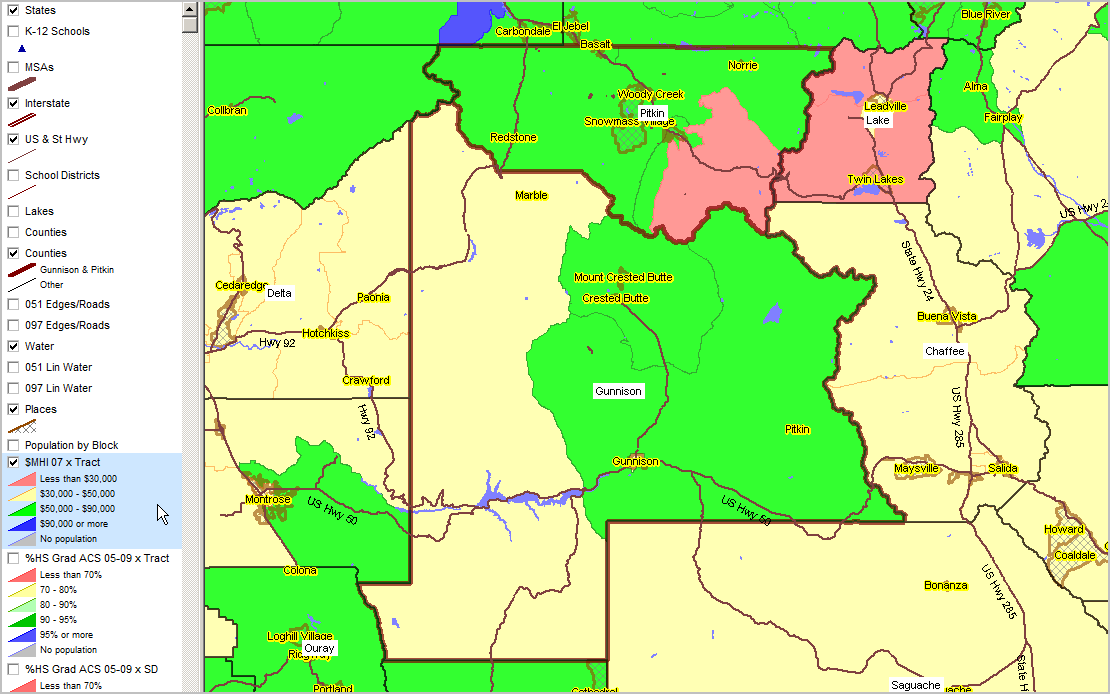
Median household income ($MHI) by census tract. Data based on 2009 American Community Survey (http://proximityone.com/acs.htm) 5-year estimates, centric to mid-2007. See $MHI color patterns in highlighted layer in legend at left of map view.
|
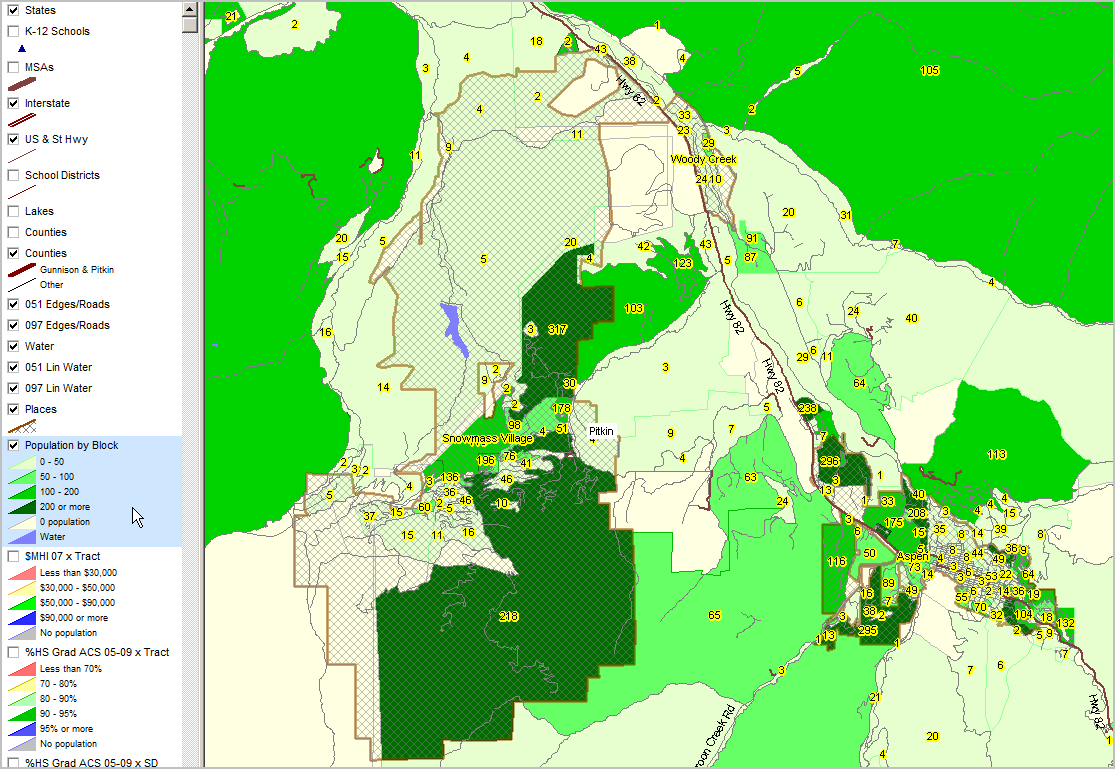
Data based on Census 2010 (http://proximityone.com/cen2010.htm). See color patterns in highlighted layer in legend at left of map view.
|
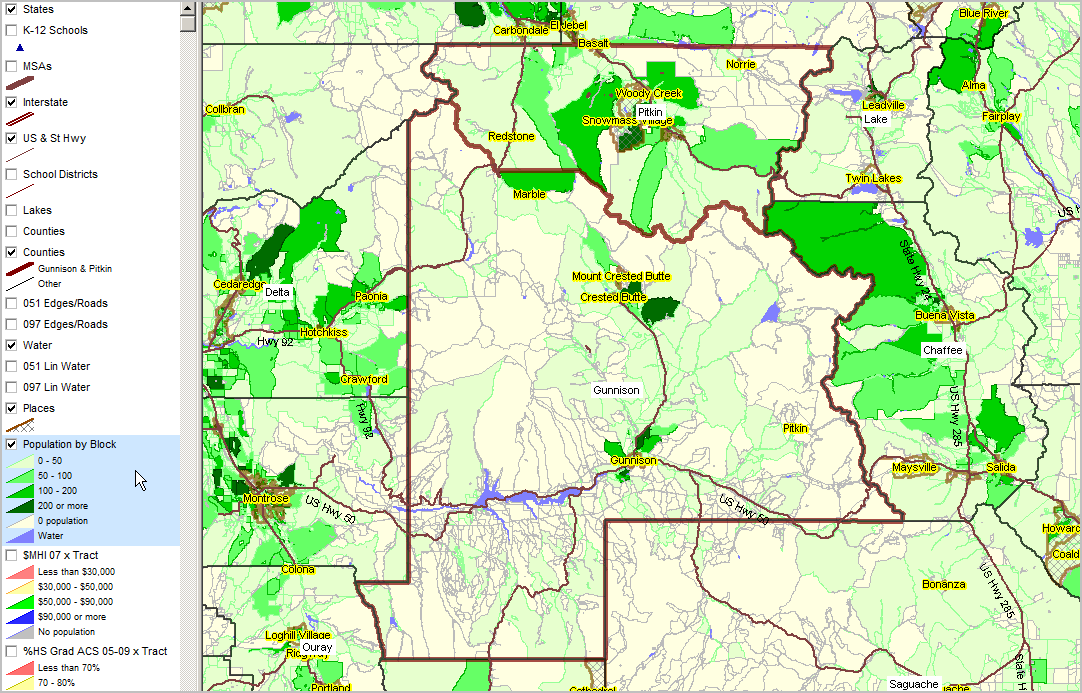
Data based on Census 2010 (http://proximityone.com/cen2010.htm). See color patterns in highlighted layer in legend at left of map view.
|
Data based on Census 2010 (http://proximityone.com/cen2010.htm). See color patterns in highlighted layer in legend at left of map view.
|
Data based on Census 2010 (http://proximityone.com/cen2010.htm). See color patterns in highlighted layer in legend at left of map view.
|
Data based on Census 2010 (http://proximityone.com/cen2010.htm). See color patterns in highlighted layer in legend at left of map view.
|