Houston ISD, TX

Contents
Selected CV XE GIS project/application views in Texas.
Click toggle in Table of Contents at left to view sub-state applications.
Integrating shapefiles, ACS demographics, Census 2010 demographics, estimates & projections and related data.
See related interactive ranking tables:
| • | Texas school district demographics: http://proximityone.com/tx_sdc.htm. |
| • | Texas census tract demographics: http://proximityone.com/tracts11dp1.htm. |
| • | Census 2010 demographics: http://proximityone.com/s&o_comparative_profiles.htm |
(all US geography: state, congressional district, county, school district, city/place, metro)
Join the conversation .. ProximityOne on Twitter -- https://twitter.com/ProximityOne
The toggle graphic -- ![]() -- indicates an expanding section. Click the toggle or toggle line to view/close expanding sections.
-- indicates an expanding section. Click the toggle or toggle line to view/close expanding sections.
The table presented below provides a summary demographic profile for the district based on the Census 2010 P.L. 94-171 data. Similar to a profile developed by Census, this profile also includes two columns providing characteristics for the population under 18 years of age. These profiles are available for any Census 2010 geography, census block and higher level geography.
ProximityOne -- additional details and interactive ranking table
|
||||||||||||||||||||||||||||||||||||||||||||||||||||||||||||||||||||||||||||||||||||||||||||||||||||||||||||||||||||||||||||||||||||||||||||||||||||||||||||||||||||||||||||||||||||||||||||||||||||||||||
Children's Demographics by Type of Enrollment
Age distributions by type of enrollment universe
Data centric to mid-2007 are based on the ACS 2009 School District Special Tabulation released May 2011
- Houston ISD, TX -- http://proximityone.com/sdst/b010014823640.htm
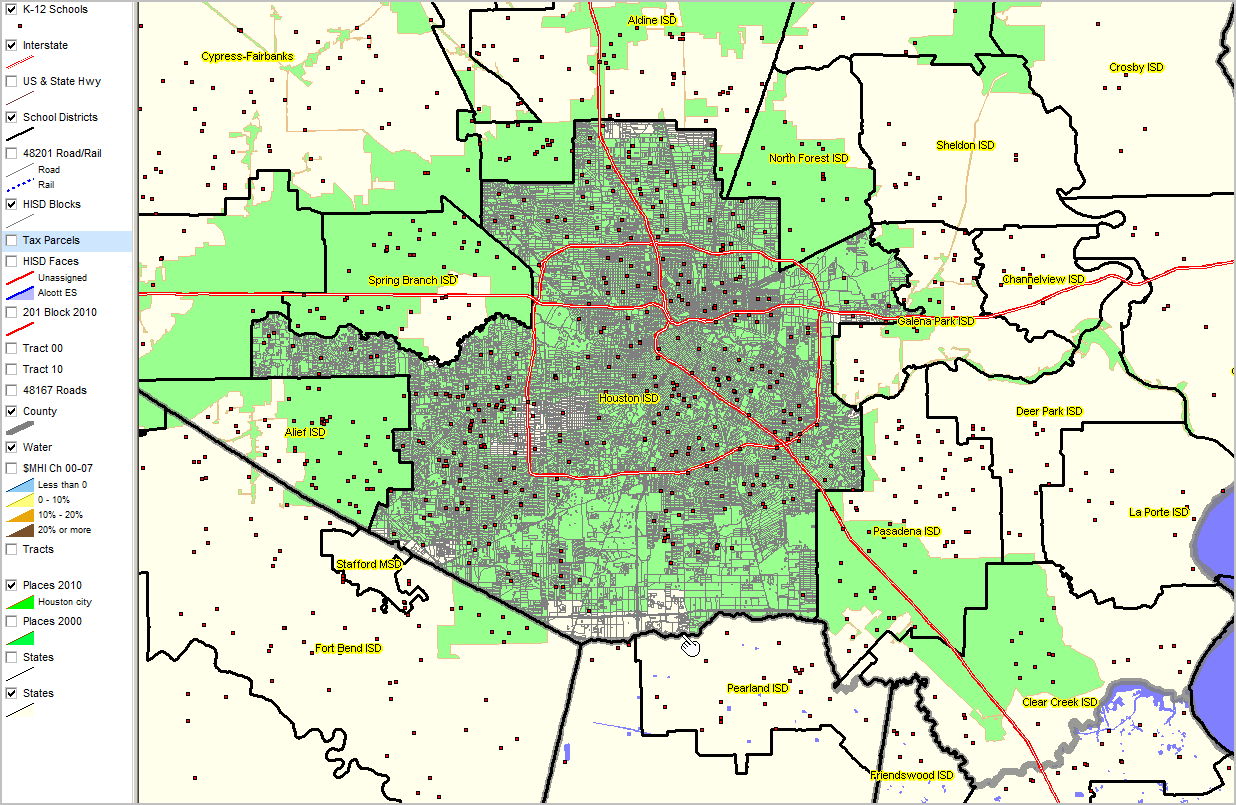
Selected Views focused on Houston Independent School District
Houston city - green fill pattern Houston ISD by Census 2010 census block (35,000+) gray boundaries County (bold gray boundary) and area school districts (bold lack boundaries) with yellow labels Interstate K-12 schools (red markers)
|
ACS 2009 5-year demographic estimates
See related Census 2000 and ACS 2009 Texas census tract demographics in query/ranking tables: -- Texas only, more subject matter detail ACS 2009 only -- http://proximityone.com/ustr0509_tx.htm. -- All states, Census 2000, ACS 2009 and change; population and housing units -- http://proximityone.com/tracts.htm.
|
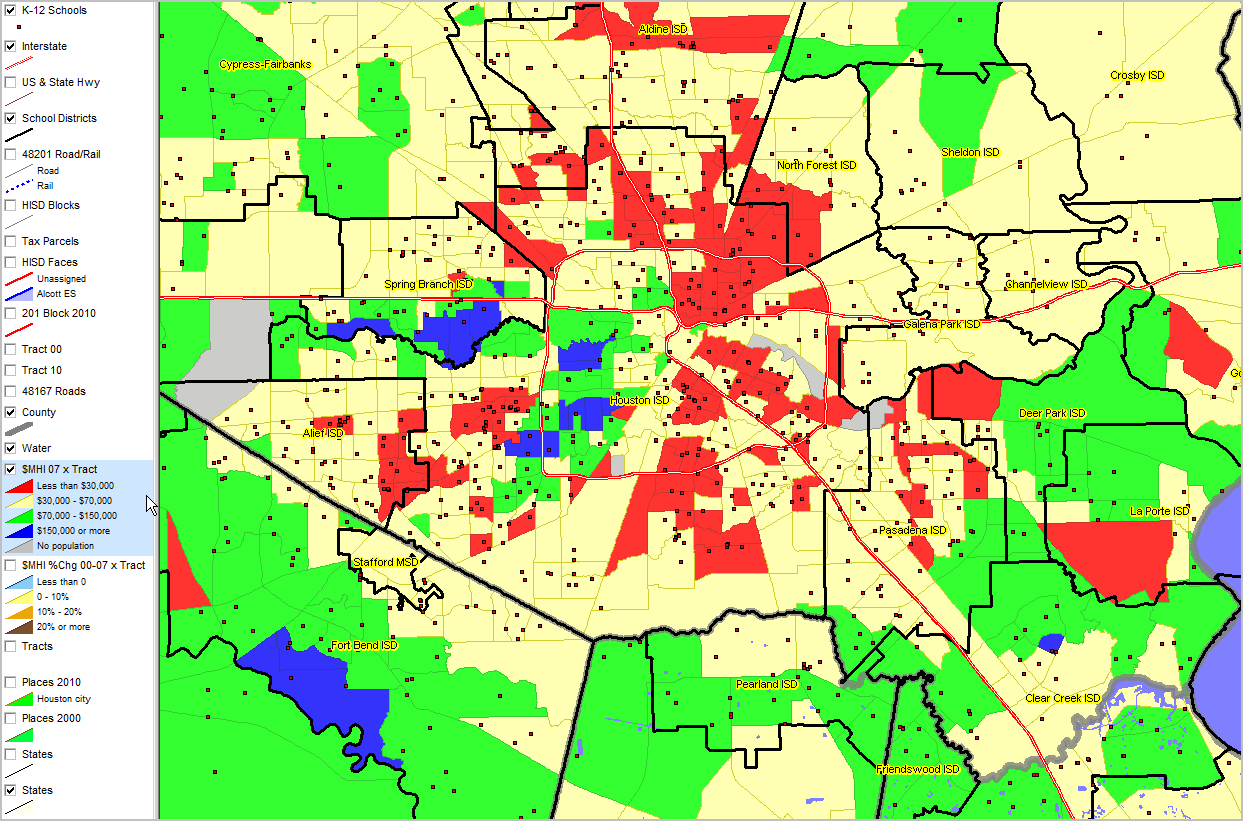
| Patterns of Economic Prosperity -- Median Household Income %Change since Census 2000 by Census Tract |
|

West University Elementary Attendance Zone by Census 2010 Census Block Census Block 48-201-412400-1014 profiled
|
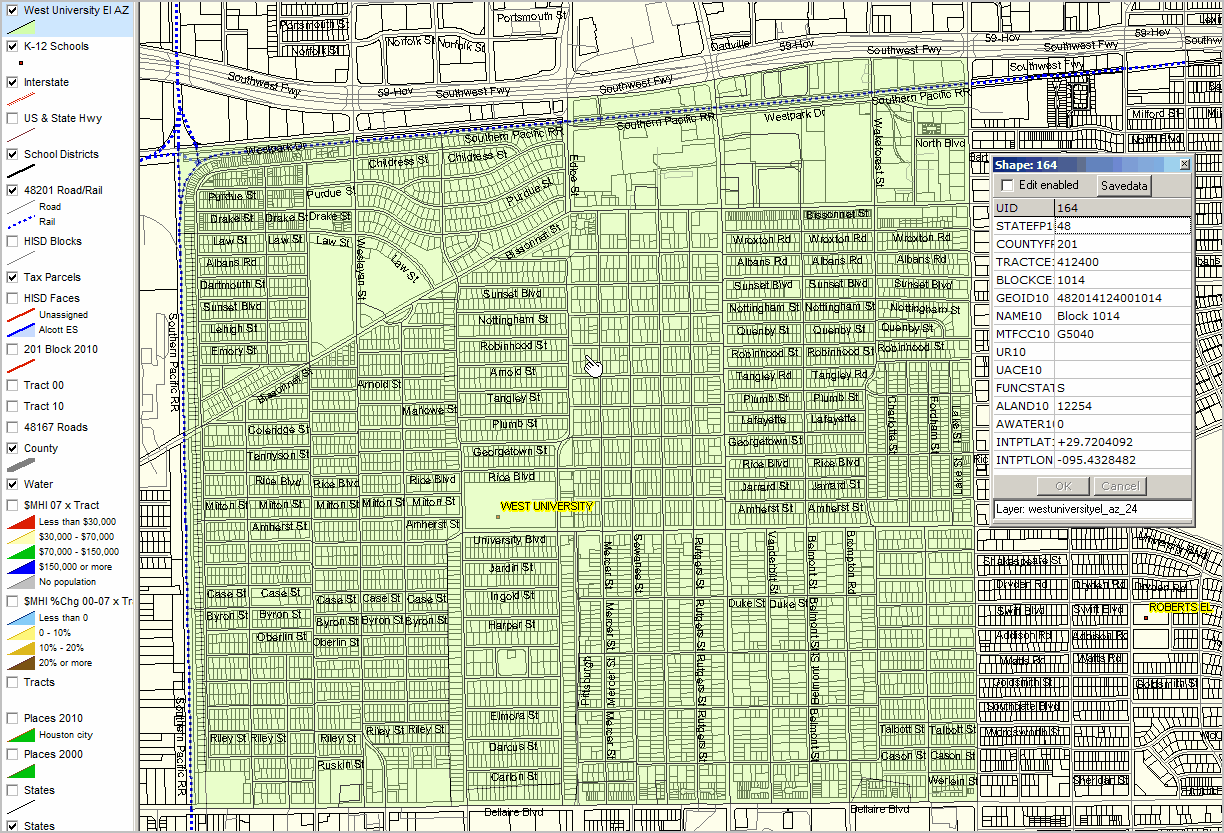
View boundary from HISD website -- http://dept.houstonisd.org/ab/SchoolBoundaryMaps/westuniversityES.pdf Tax Parcel Layer off; same census block (see above) profiled.
|
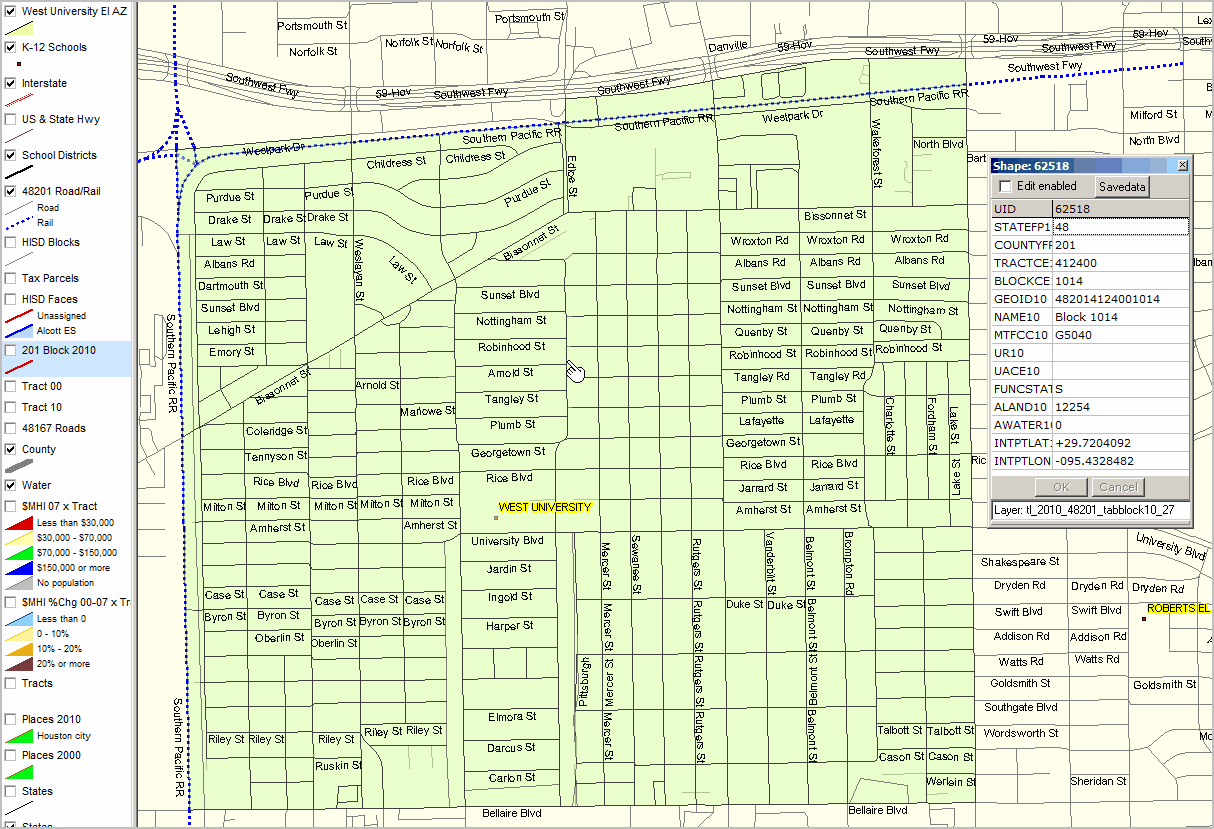
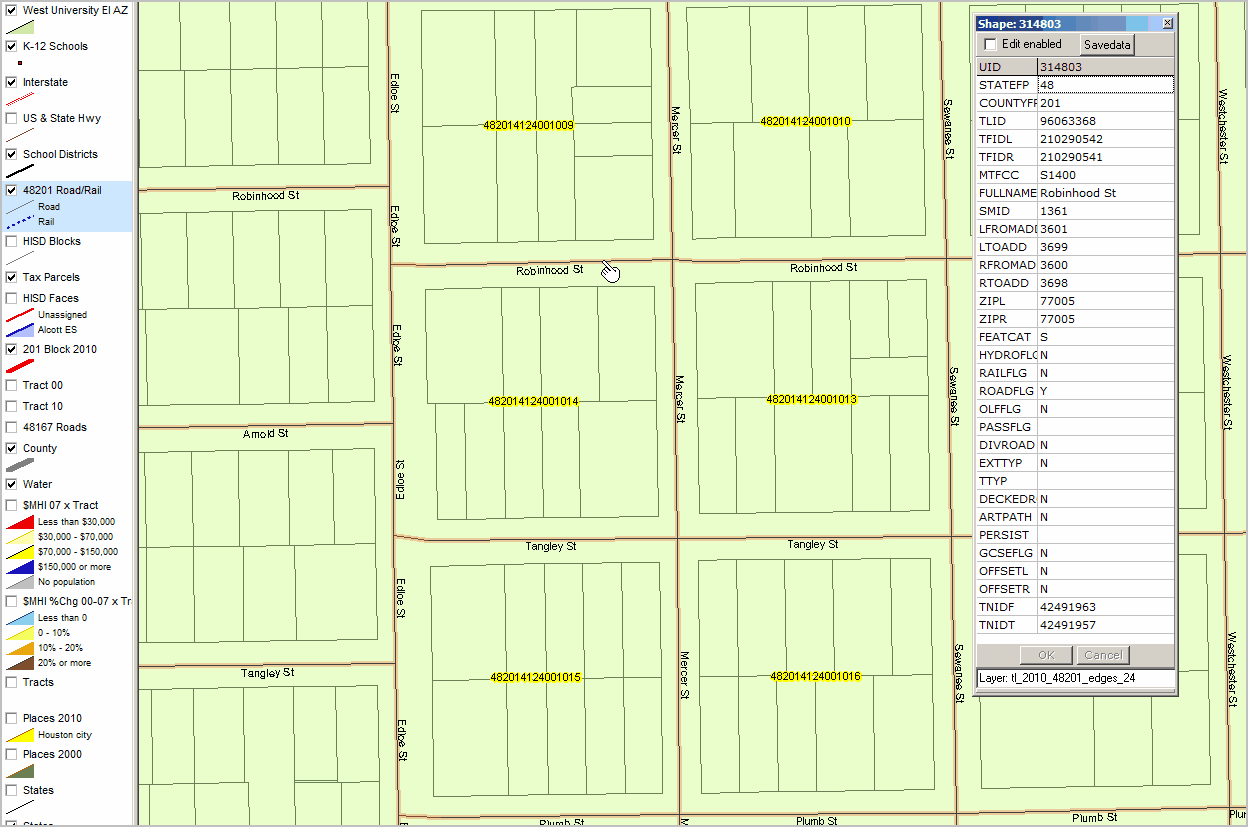
Census Block boundaries shown. Identify tool used to show profile of block 1014 bounding street segment.
|
Census 2010 Block 1014 shown in above views was part of several "city blocks" in Census 2000 Block 1007. Census 2000 Block 1007 shown in map as cross-hatched area; profile of Census 2000 block 1007 shown. See tabular view/relationships in next toggle view.
|
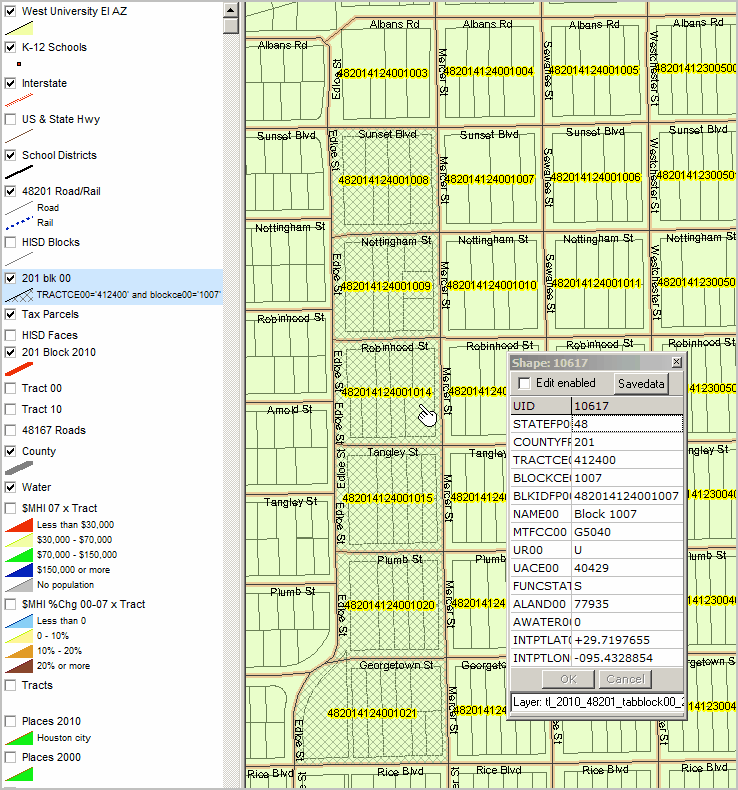
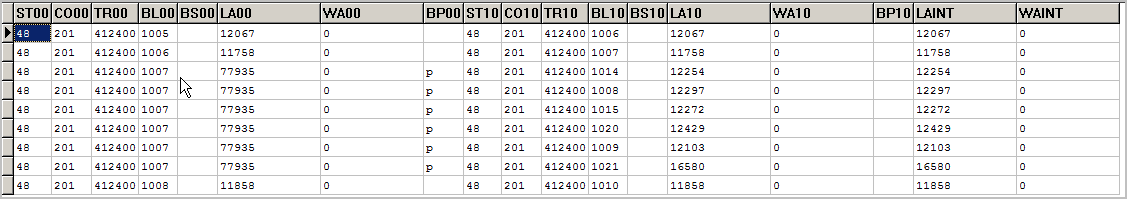
CV database browser view of Census 2000 block 1007 and partial relationships with Census 2010 blocks. Seven records appear for Census 2000 block 1007 and corresponding Census 2010 blocks. Census 2010 block 1014 (used in earlier sections) contains 12,254 square meters of Census 2000 block 1007. Note that what was Census 2000 census block 1006 is Census 2010 census block 1007. All census block references here relate to state 48, county 201 and tract 412400. This is a simple case illustration; some equivalences not only change tract and county but also state.
|