Southeast Kansas

Contents
Selected CommunityViewer project/application views in Kansas.
Click toggle in Table of Contents at left to view sub-state applications.
Integrating Census 2010 TIGER Shapefiles, ACS 2009 5-year demographics, Census 2010 demographics and related data.
See related interactive ranking tables:
| • | Kansas school district demographics: http://proximityone.com/sd_ks.htm. |
| • | Kansas census tract demographics: http://proximityone.com/ustr0509_ks.htm. |
| • | Census 2010 demographics: http://proximityone.com/cen2010_pl94171.htm |
(all US geography: state, congressional district, county, school district, city/place, metro)
Selected Southeast Kansas Views & Site Analysis
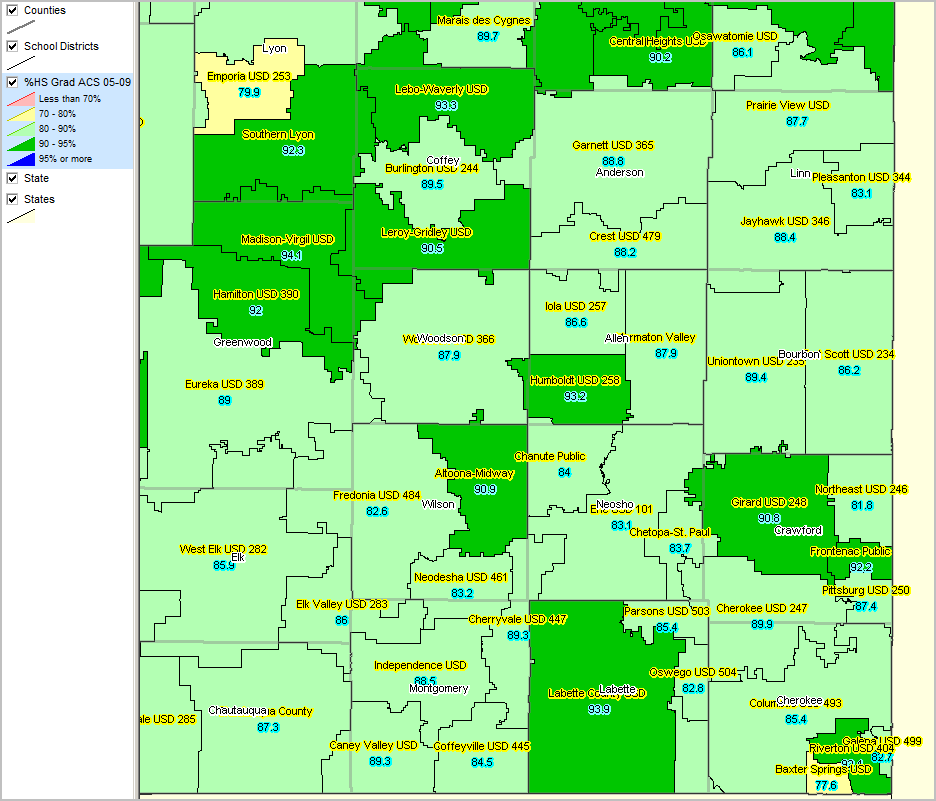
Educational Attainment by School District Percent high school graduate (population 25 years and over) by school district. Data based on 2009 American Community Survey (http://proximityone.com/acs.htm) 5-year estimates, centric to mid-2007. See related ranking table http://proximityone.com/sd_ks.htm.
See thematic pattern scale in legend at left of map.
County boundaries gray with transparency; county name at county center with white background label. School district name label with yellow background. Additional school district label "S095YR66" -- percent high school graduate in district (ACS 2009 5-year estimate). See list of additional subject matter items that could be displayed (numerically or thematic pattern): http://proximityone.com/dep2.htm.
|
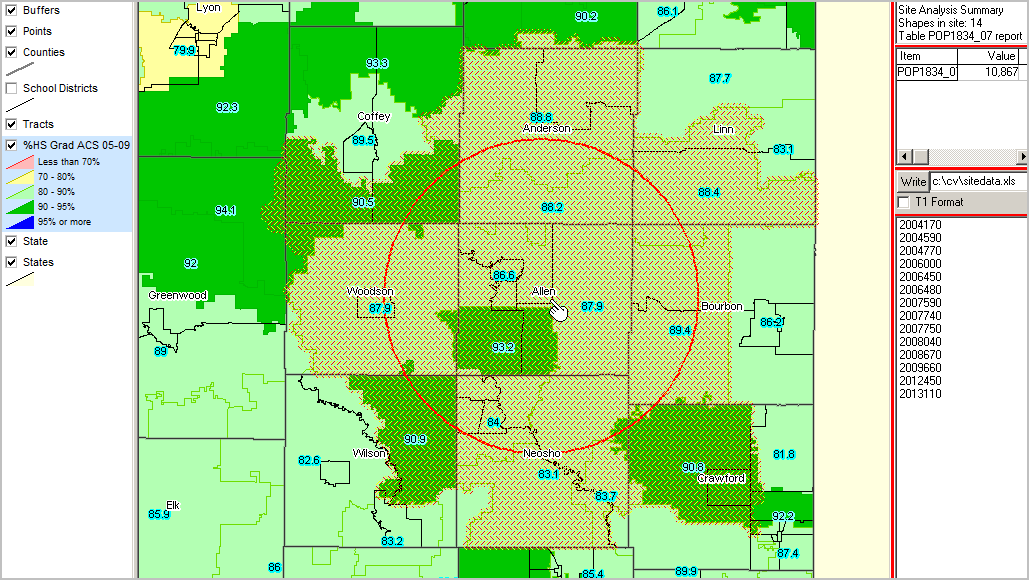
The following view illustrates use of the CV site analysis tool to examine the population ages 18-34, based on the 2009 ACS 5-year estimates, by school district for those school districts touching or contained within a 25 mile radius from the center of Allen County. The total number is 10,867 (upper right table in graphic); code for school districts included are listed in the lower right listbox. Any radius could be chosen or cherry-pick select and aggregate automatically. This example shows use of school districts but other geography, such as census tracts, block groups or whole counties could be used.
|
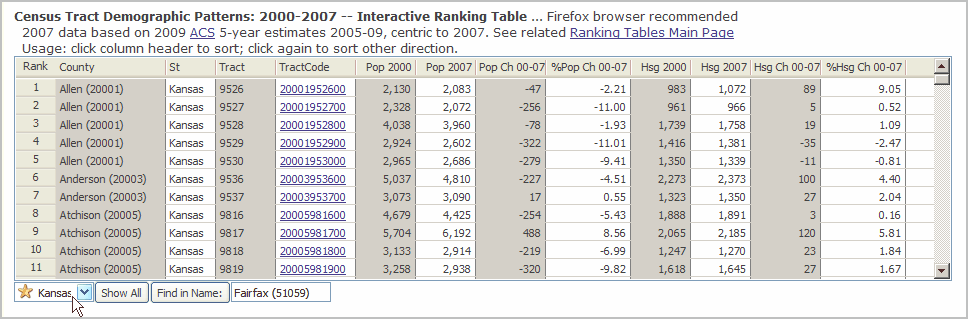
Use http://proximityone.com/tracts.htm to examine population and housing units in 2000 and change since 2000. The following graphic illustrates a query to view only Kansas tracts (using dropdown selector below table).
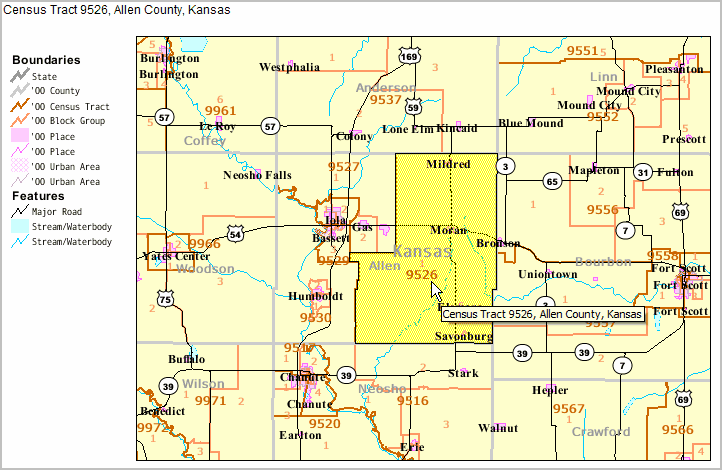
Click a link in the TractCode column to view a map of the tract:
|