Long Island Area

Contents
Selected CommunityViewer project/application views in New York/Long Island Area.
Click toggle in Table of Contents at left to view sub-state applications.
Items 1-4 show applications developed using the Census 2010 TIGER/Line shapefiles with integrated demographics from the 2009 ACS 5-year estimates and related non-Census sourced data.
Selected New York Metro Area Views
More about metros and Situation & Outlook
| • | Metropolitan Area Guide: http://proximityone.com/metros/guide |
| • | MetroView: demographic-economic profiles & patterns -- http://proximityone.com/metroview.htm |
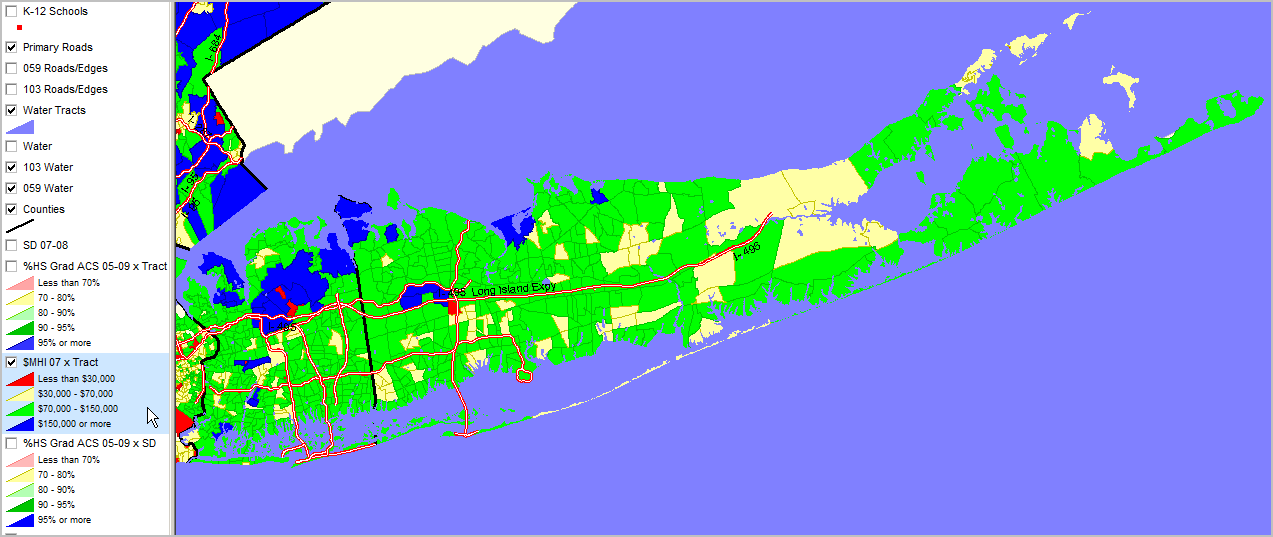
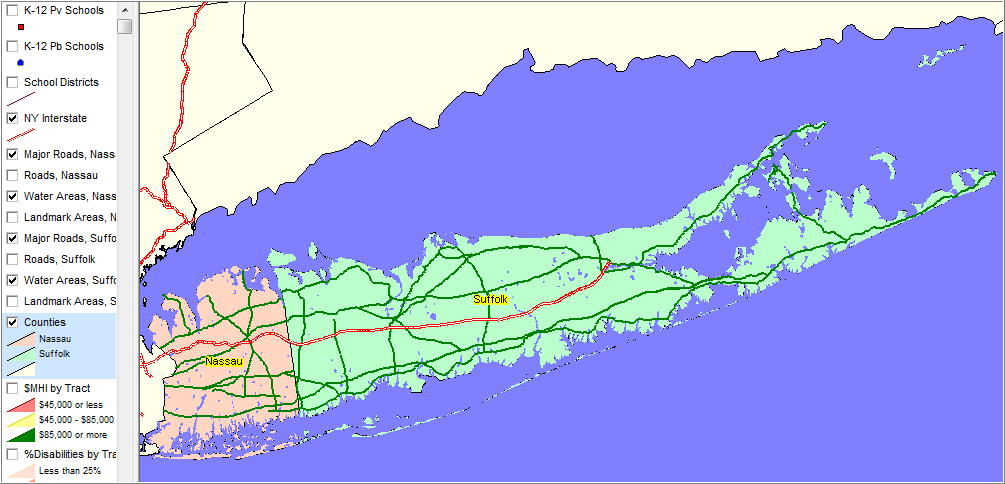
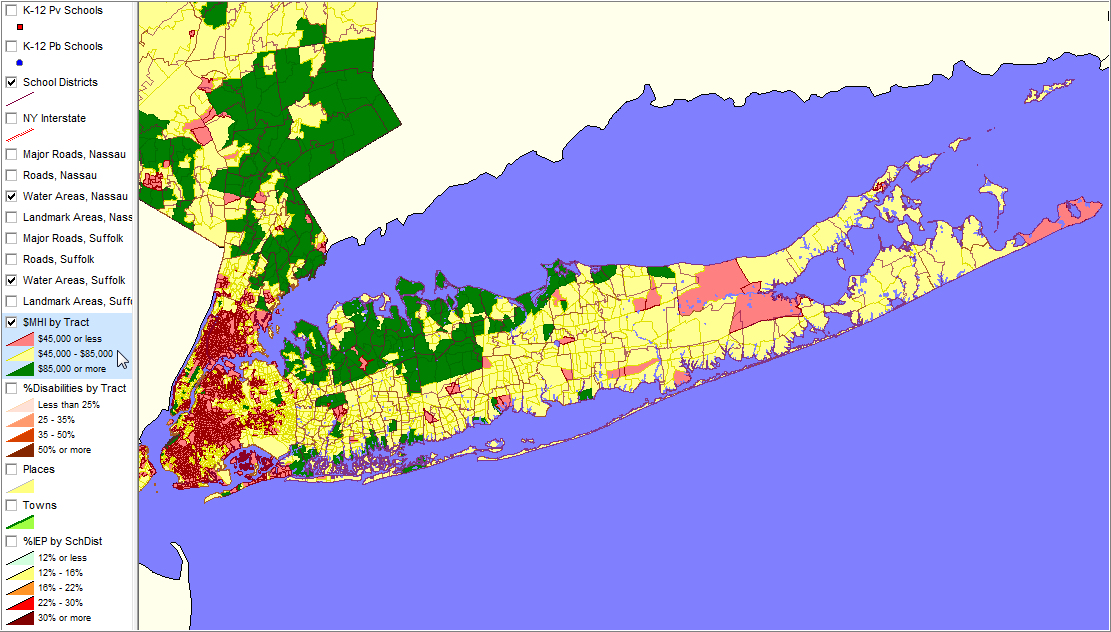
Median household income ($MHI) by census tract. Data based on 2009 American Community Survey (http://proximityone.com/acs.htm) 5-year estimates, centric to mid-2007. See related ranking table http://proximityone.com/ustr0509_ny.htm.
See $MHI color patterns in highlighted layer in legend at left of map view.
|
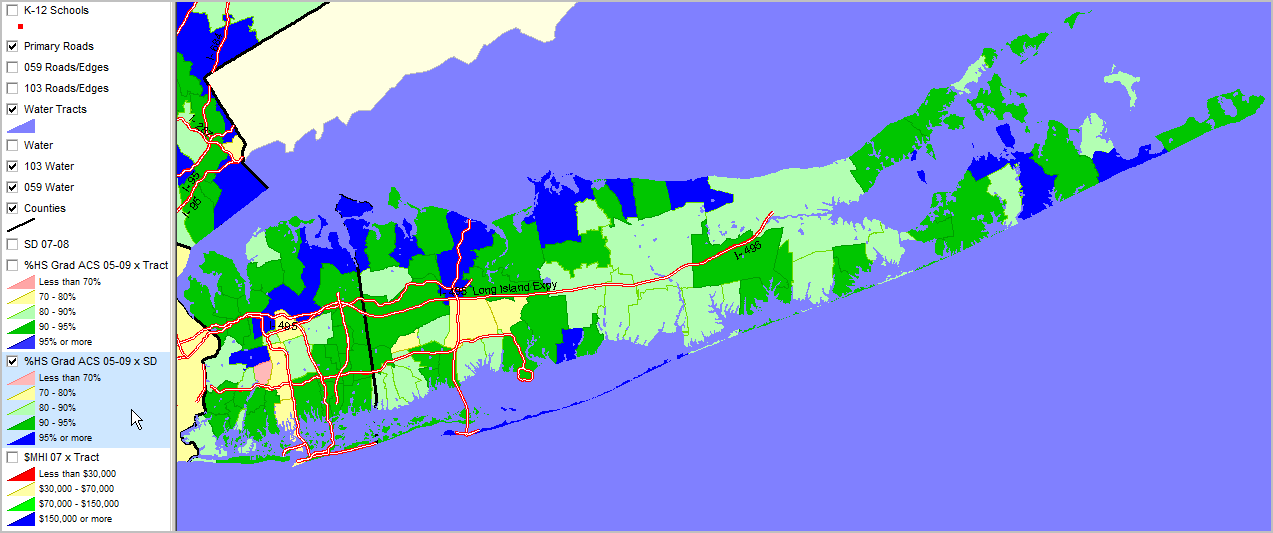
Assessing educational attainment by school district can "mask" incidence of lower educational attainment when examined by neighborhood.
Compare the next two views
Educational Attainment by School District Percent high school graduate (population 25 years and over) by school district. Data based on 2009 American Community Survey (http://proximityone.com/acs.htm) 5-year estimates, centric to mid-2007. See related ranking table http://proximityone.com/sd_ny.htm.
See educational attainment color patterns in highlighted layer in legend at left of map view.
|
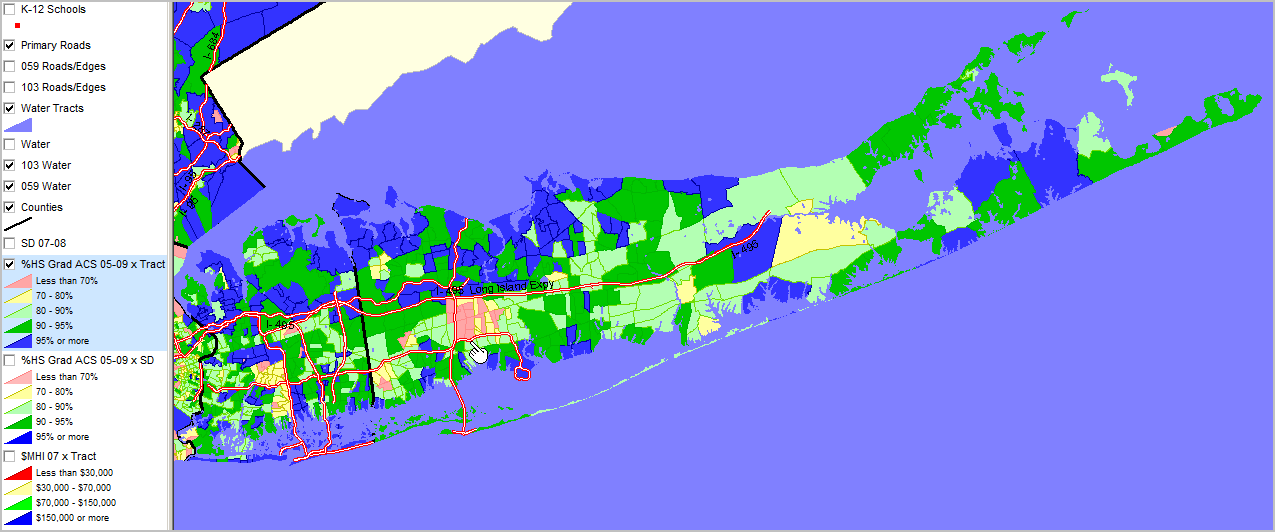
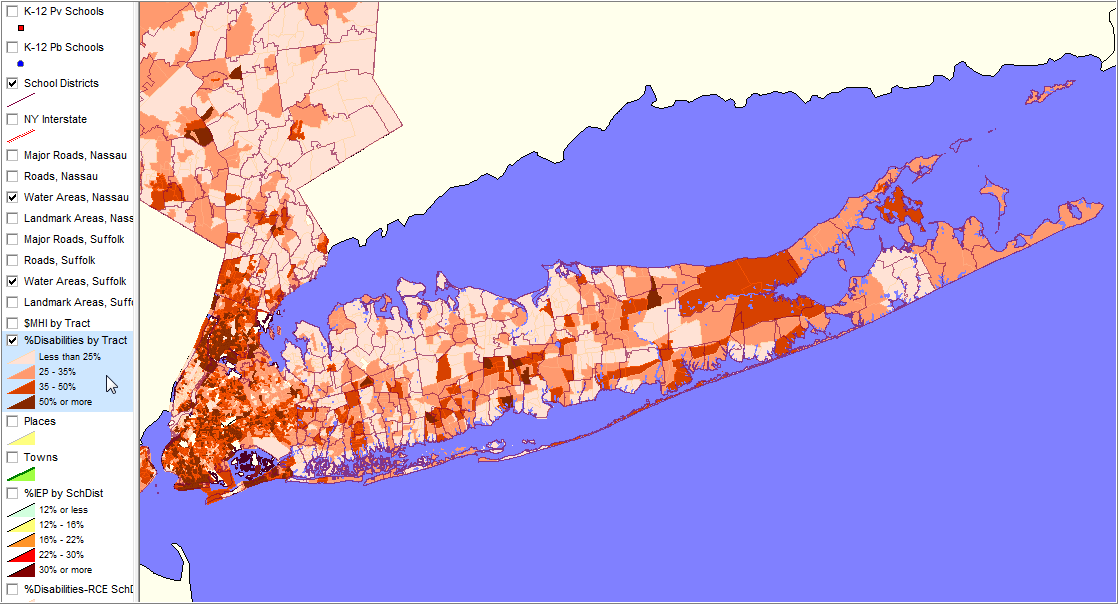
Assessing educational attainment by school district can "mask" incidence of lower educational attainment. Compare area near pointer in the map below to that area in the map by school district above.
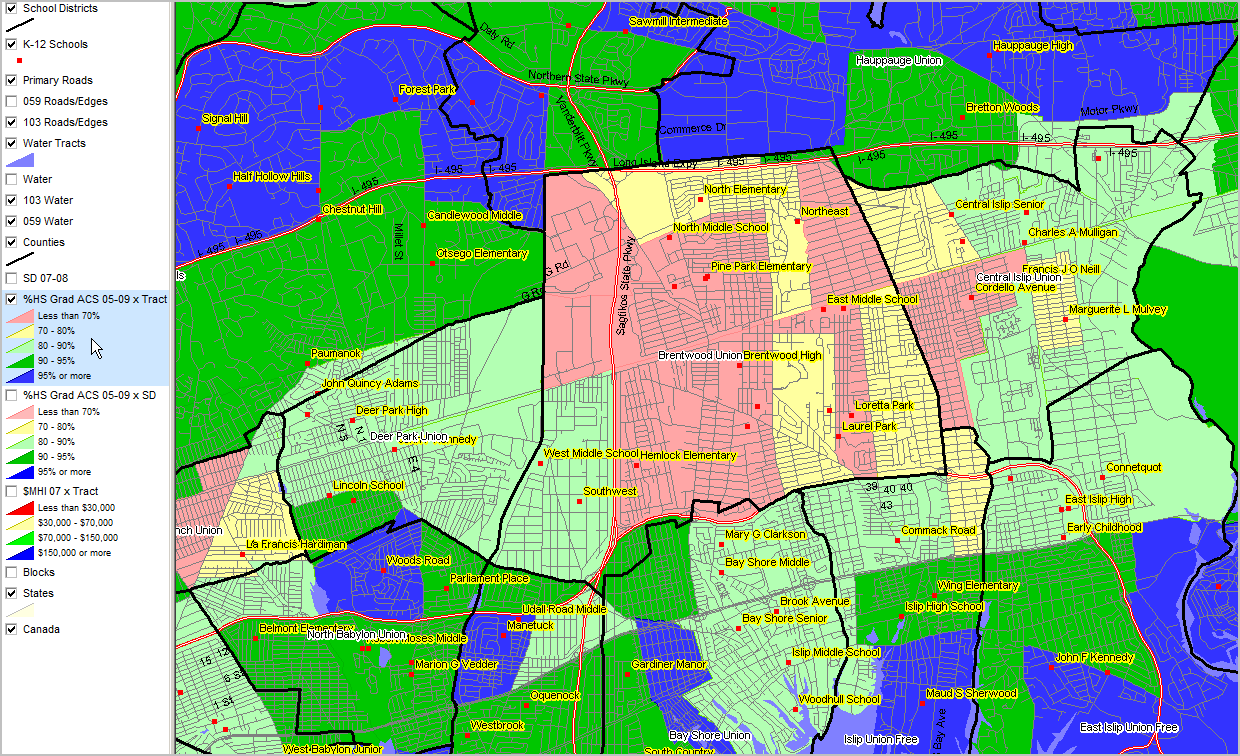
Educational Attainment by Census Tract Percent high school graduate (population 25 years and over) by school district (this view shows only elementary & unified school districts). Data based on 2009 American Community Survey (http://proximityone.com/acs.htm) 5-year estimates, centric to mid-2007. See related ranking table http://proximityone.com/ustr0509_ny.htm.
See educational attainment color patterns in highlighted layer in legend at left of map view.
|
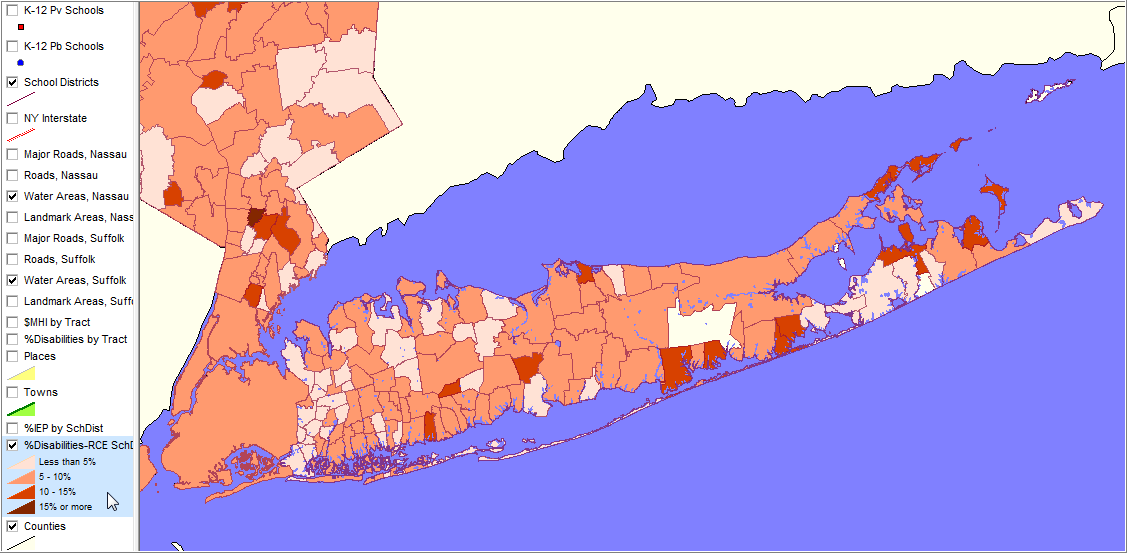
Educational Attainment by Census Tract Percent high school graduate (population 25 years and over) by school district. Data based on 2009 American Community Survey (http://proximityone.com/acs.htm) 5-year estimates, centric to mid-2007. See related ranking table http://proximityone.com/ustr0509_ny.htm.
View shows Interstate, all roads and K-12 public schools as red markers.
See educational attainment color patterns in highlighted layer in legend at left of map view.
|
Remainder of this section has been developed for a Long Island centric project longisland1.gpr. While views and examples shown here are mainly for Nassau and Suffolk counties, most layers/shapefiles cover the state of New York.
|
See color/interval patterns in highlighted legend layer at left.
|
This view corresponds to the national view shown under U.S. National Scope. The intervals and colors differ some but the nature of subject matter and description applies.
|
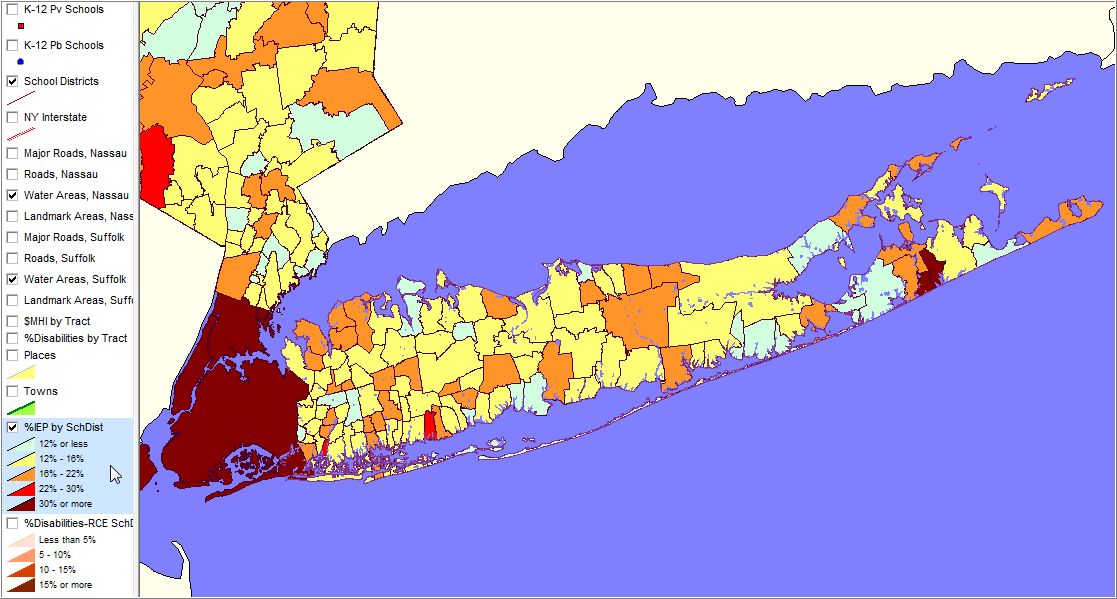
This view corresponds to the national view shown under U.S. National Scope. See http://proximityone.com/childrens_demographics/guide/index.htm?extended_data.htm for more information about grade relevant children's own disability characteristics (tables P41 and P42) from Census 2000 school district special tabulation. Sample table profiles are shown in these sections: Houston ISD, TX -- Table P41 Data Houston ISD, TX -- Table P42 Data. Use the Proximity DMIGateway tool to access these data for any school district. The following graphic shows P41001 as a percent of P42001. Much more detail by type of disability is available in these tables and thus other patterns could be viewed using CV.
|
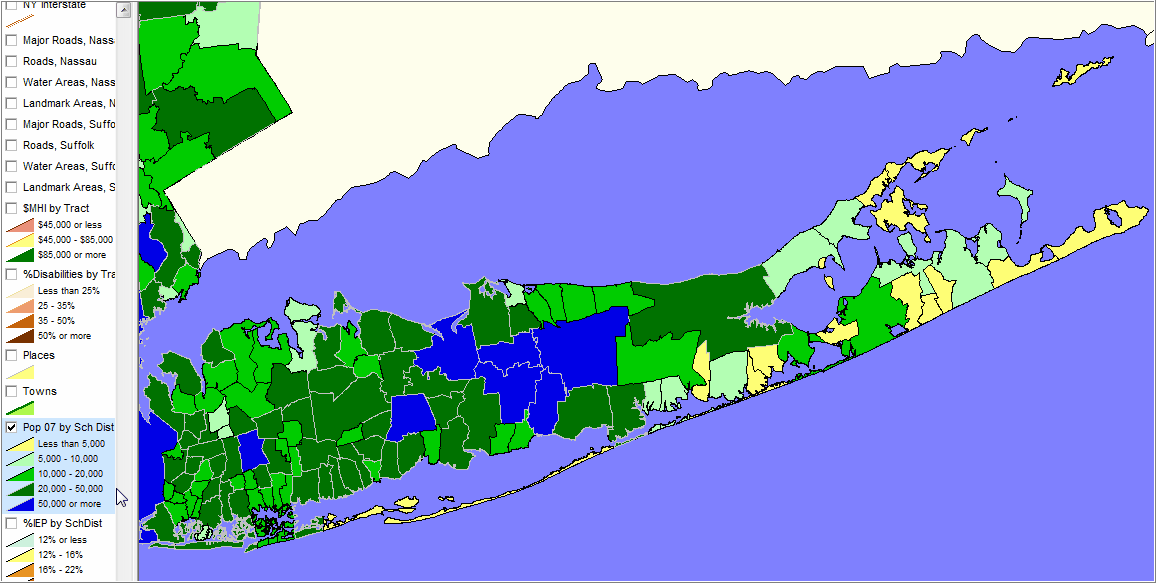
This view corresponds to the national view shown under U.S. National Scope.
|
This view is provided to illustrate the diversity of subject matter available that can be used to develop thematic maps. These subject matter are Census 2000; similar data from the American Community Survey 2005-09 program will be available in later 2010 enabling longitudinal analysis and updated characteristics.
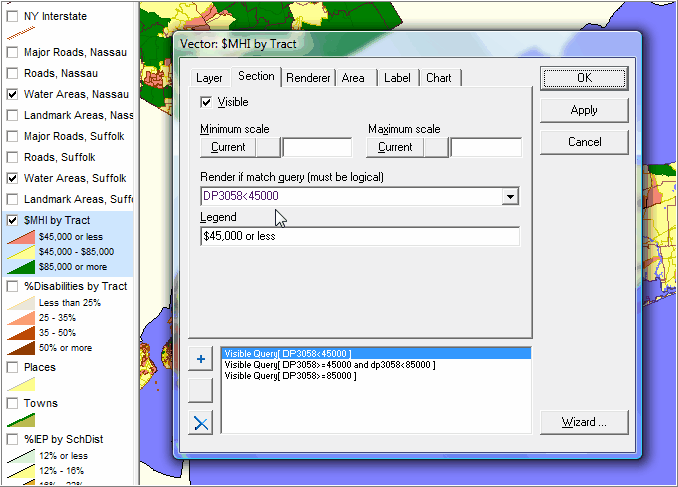
The list of items included for this layer is at http://proximityone.com/dp3.htm. To develop the above view, the layer editor is used to set "section" values as shown in this the following graphic. "DP3058" (median household income) is set to <45000 for the first section. Any other "DP3" item can be used directly or in algebraic combination with other items available in the shapefile dbf.
|
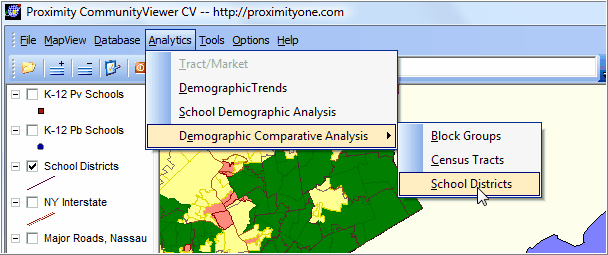
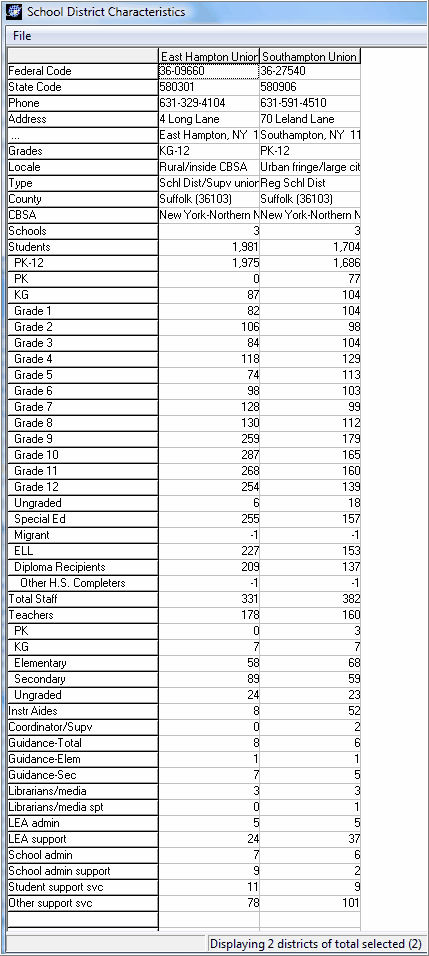
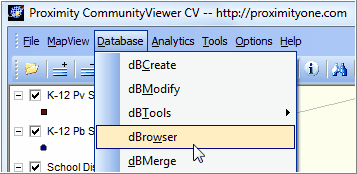
Invoke this table generating feature using the main menu Analytics>Demographic Comparative Analysis>School Districts as shown below.
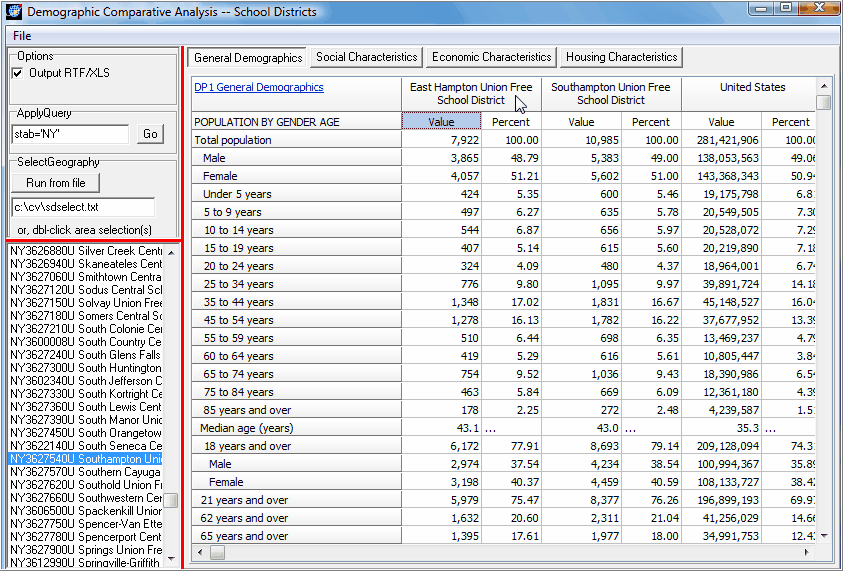
The DCA-SD form appears as shown below. The user then selects the districts (up to 3) of interest. This example shows two districts being selected. DCA-SD enables side-by-side comparative analysis for the selected district for four types of profiles. See the CV User Guide section for more information on use of this feature.
|
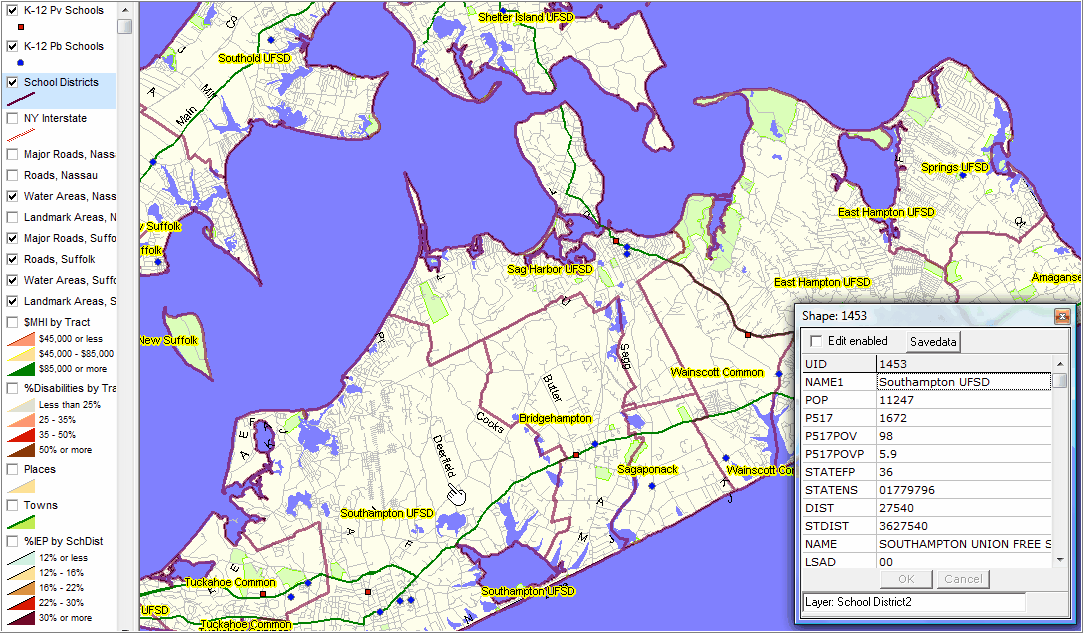
In this zoom-in view, these adjustments were made to the base project: 1) thematic patterns off (unchecked), 2) topmost school district layer setting: label changed and made visible, boundary line size increased, 3) Suffolk all roads and landmark areas checked on; 4) K-12 schools checked on. These settings could be temporary or saved as a new project, for example named c:\cv\nyfiles\longisland2.gpr (so it can be recalled at a later time). These settings affect only the project file and not the shapefiles themselves. It is not recommended to save an existing base project. The Identify tool is used to show a mini-profile for the Southampton school district (note this requires the school districts layer to be active (blue highlight).
|
Using the same settings as described in the previous view, a further zoom-in to Southampton school district shows schools with labels turned on.
|

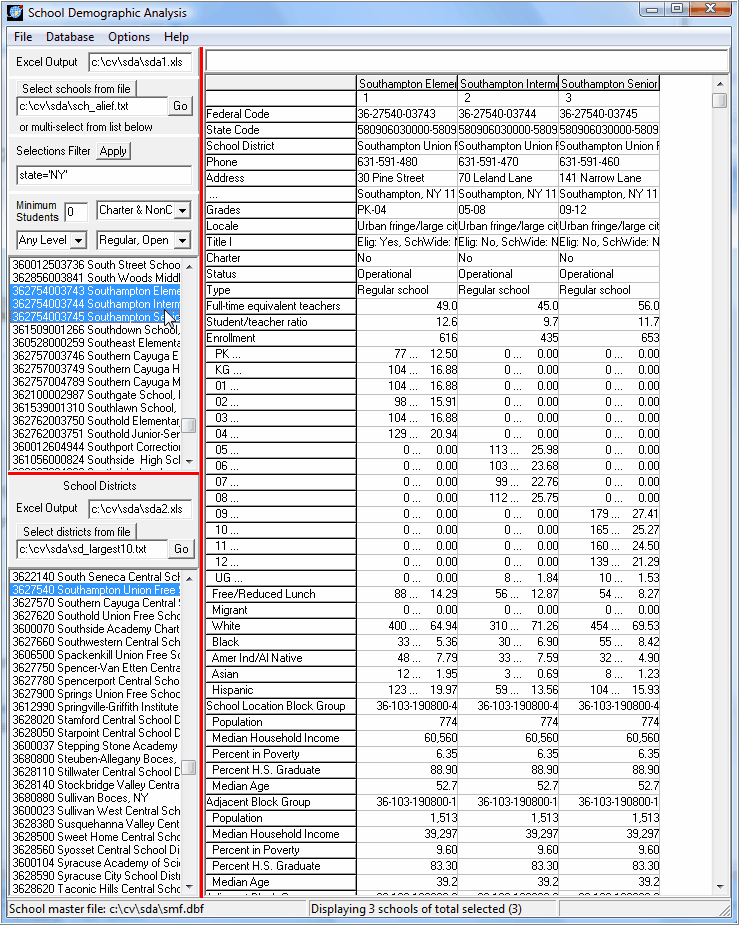
This view illustrates how schools can be compared side-by-side using the CV School Demographic Analysis feature. Administratively reported data are displayed as well as socioeconomic characteristics for the neighborhoods where the school is located. The School Demographic Analysis feature requires an additional dataset not provided with the longisland1.gpr.
|
This view illustrates how school districts can be compared side-by-side using the CV School Demographic Analysis feature. The School Demographic Analysis feature requires an additional dataset not provided with the longisland1.gpr.
|
In this series of steps, we will show how to use the CV dBrowser to selected disability related items for Long Island school districts.
|
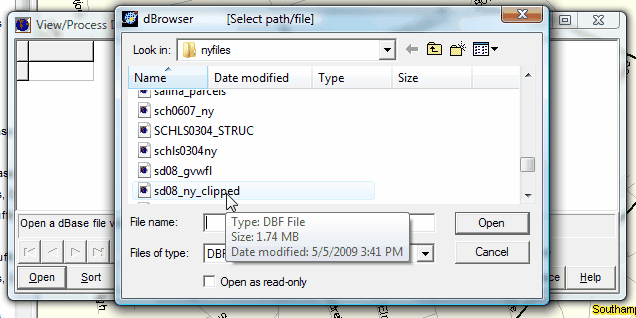
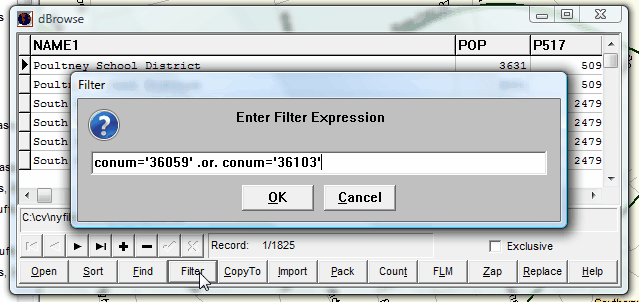
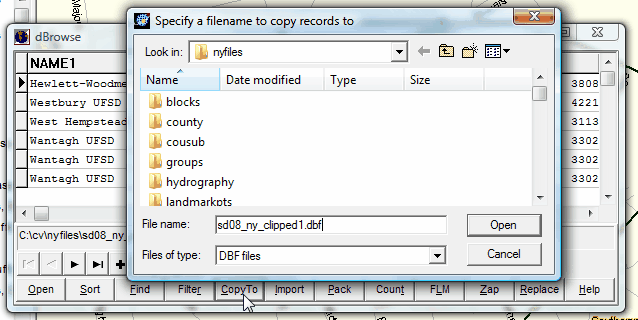
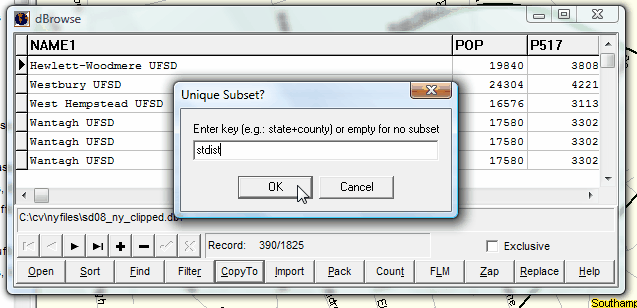
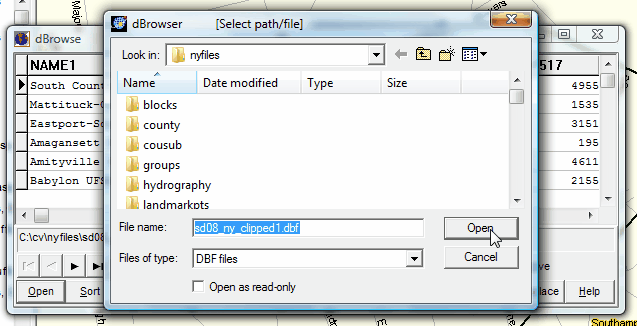
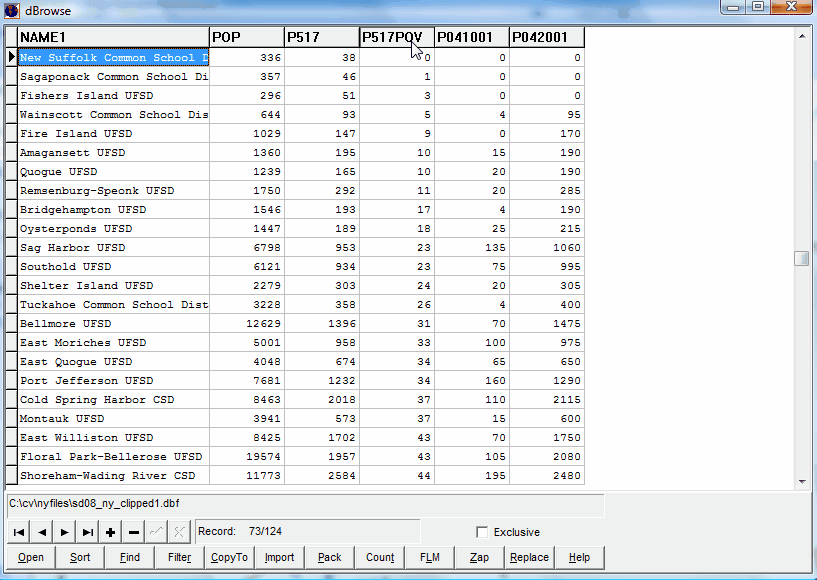
There are 124 school districts in the two county Long Island area. The file created in the previous step c:\cv\nyfiles\sd08_ny_clipped1.dbf contains a record for each Long Island school district. That file may be also be opened using Excel or any program that can open a dbase structured file.
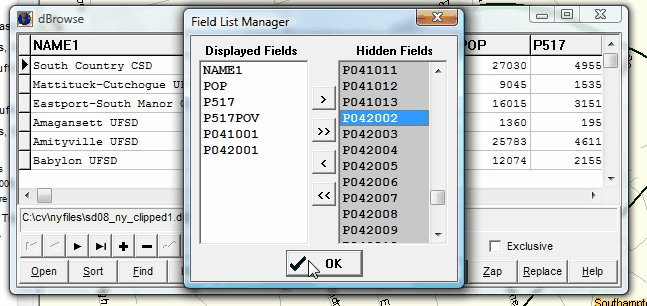
Fields in this file are described in the CV User Guide file description (blue highlight fields). In addition disability tables P41 and P42 fields are included in the file.
Authorized users (contact Proximity - add note in text section) may access this Excel file.
|
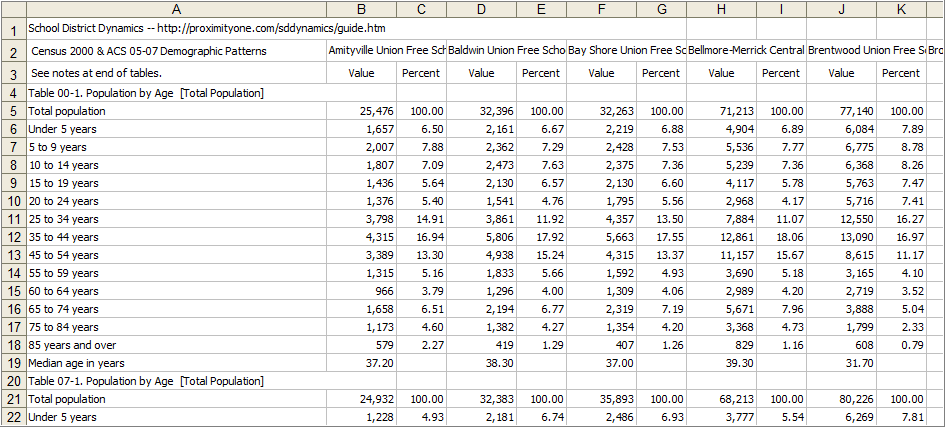
59 of the 124 school districts in the Long Island area had 2007 population of 20,000 or more. This is the minimum size population threshold to be included in the American Community Survey 2005-07 tabulations. Using the Proximity School District Dynamics (SDDynamics) resource, profiles have been prepared for all of these districts. Authorized users (contact Proximity - add note in text section) may access this Excel file.
Partial view of XLS file
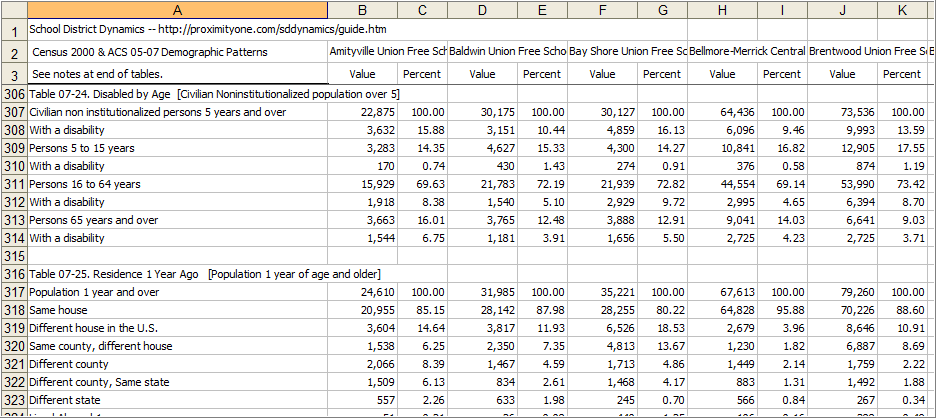
Selected Disability-related items are shown in table 24
|
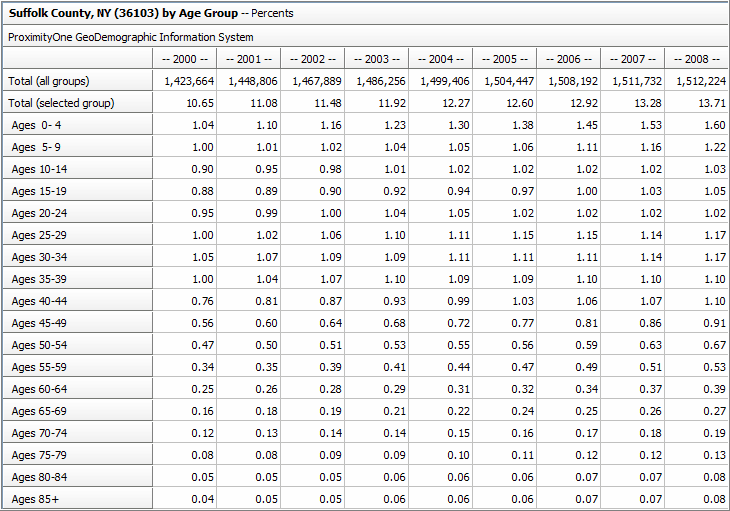
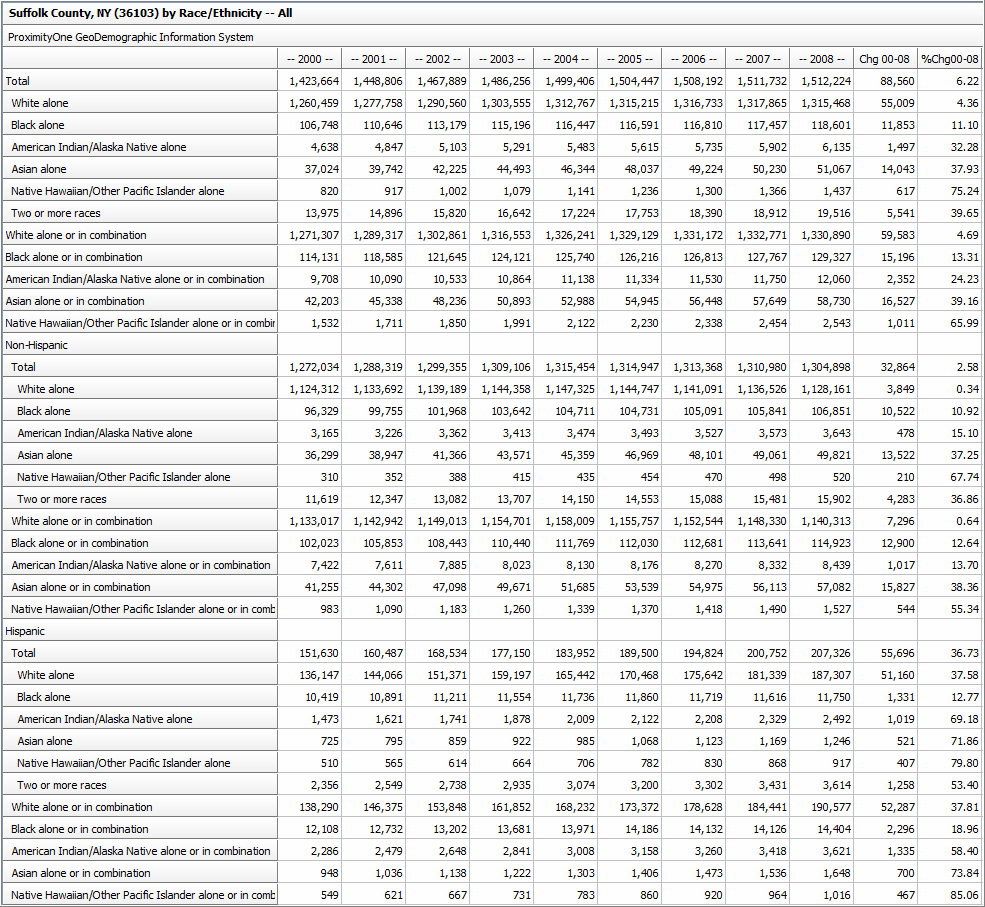
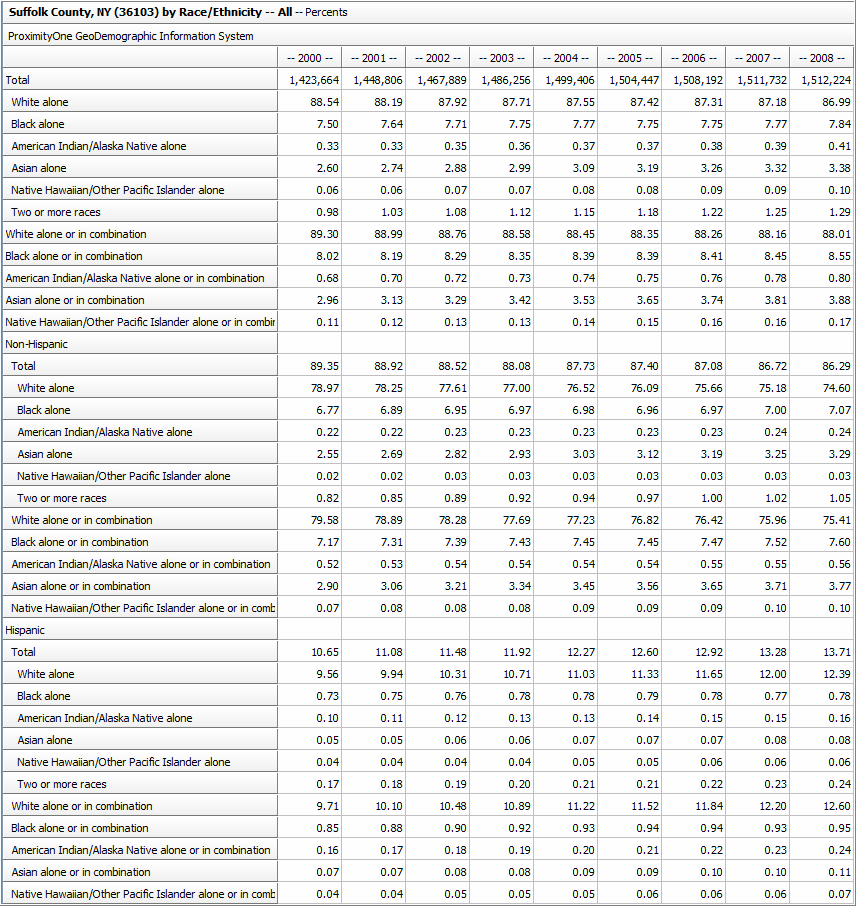
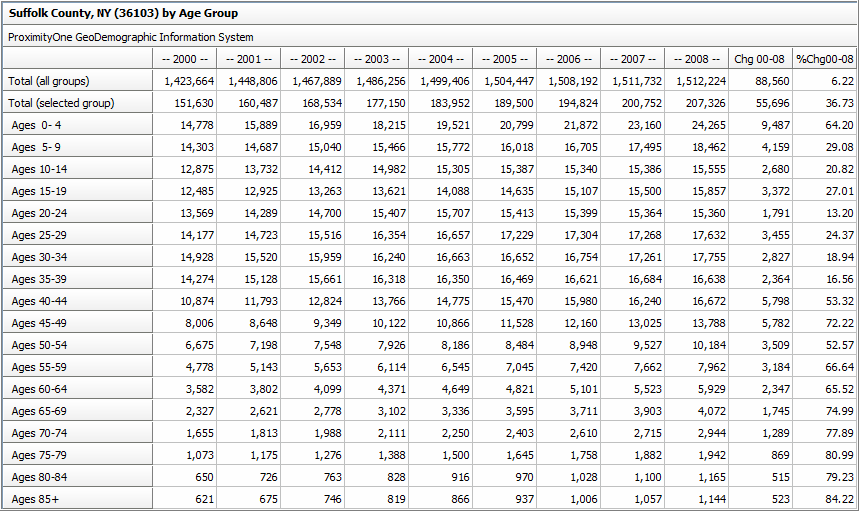
County/Region Demographic Composition/Trend Analysis
Proximity develops annual estimates and projections of subject matter items shown in these tables to 2020 under alternative scenarios. These data may be linked with CV thematic mapping/geospatial analysis and/or exported for use with other software (e.g. Excel) as well as in HTML/RTF formats for publishing in other documents.
|
|
|
|