Selected CommunityViewer project/application views in Missouri.

Click toggle in Table of Contents at left to view sub-state applications.


Integrating Census 2010 TIGER Shapefiles, ACS 2009 5-year demographics, Census 2010 demographics and related data..


See related interactive ranking tables:

Missouri school district demographics: http://proximityone.com/sd_mo.htm.
Missouri census tract demographics: http://proximityone.com/ustr0509_mo.htm.
Census 2010 demographics: http://proximityone.com/cen2010_pl94171.htm

 (all US geography: state, congressional district, county, school district, city/place, metro)


Summary of Selected Census 2010 Demographics: Nevada city, MO

The table presented below provides a summary demographic profile for the city based on the Census 2010 P.L. 94-171 data.  Similar to a profile developed by Census, this profile also includes two columns providing characteristics for the population under 18 years of age.  These profiles are available for any Census 2010 geography, census block and higher level geography.


Census 2010 PL94171 Demographic Profile -- Nevada city, MO Census 2010 P.L. 94-171 Profile -- Nevada city, MO (MO0470452)
ProximityOne -- additional details and interactive ranking table  


SubjectTotal18 years and overUnder 18 years
NumberPercentNumberPercentNumberPercent
  POPULATION
  Total Population 8,386 100.0 6,436 100.0 1,950 100.0
  RACE
    One Race 8,256 98.4 6,364 98.9 1,892 97.0
      White 7,976 95.1 6,157 95.7 1,819 93.3
      Black or African American 91 1.1 66 1.0 25 1.3
      American Indian and Alaska Native 67 0.8 54 0.8 13 0.7
      Asian 66 0.8 44 0.7 22 1.1
      Native Hawaiian and Other Pacific Islander 3 0.0 2 0.0 1 0.1
      Some Other Race 53 0.6 41 0.6 12 0.6
    Two or More Races 130 1.6 72 1.1 58 3.0

  HISPANIC OR LATINO AND RACE
    Hispanic or Latino (of any race) 167 2.0 121 1.9 46 2.4
    Not Hispanic or Latino 8,219 98.0 6,315 98.1 1,904 97.6
      One Race 8,106 96.7 6,252 97.1 1,854 95.1
        White 7,884 94.0 6,092 94.7 1,792 91.9
        Black or African American 89 1.1 64 1.0 25 1.3
        American Indian and Alaska Native 60 0.7 47 0.7 13 0.7
        Asian 66 0.8 44 0.7 22 1.1
        Native Hawaiian and Other Pacific Islander 3 0.0 2 0.0 1 0.1
        Some Other Race 4 0.0 3 0.0 1 0.1
      Two or More Races 113 1.3 63 1.0 50 2.6

  HOUSING UNITS
    Total housing units 4,018 100.0    

  OCCUPANCY STATUS
      Occupied housing units 3,491 86.9    
      Vacant housing units 527 13.1    
 Data source: Census 2010, P.L. 94-171 data files.
Summary of Selected Census 2010 Demographics: Nevada R-V School District, MO

The table presented below provides a summary demographic profile for the school district based on the Census 2010 P.L. 94-171 data.  Similar to a profile developed by Census, this profile also includes two columns providing characteristics for the population under 18 years of age.  These profiles are available for any Census 2010 geography, census block and higher level geography.


Census 2010 PL94171 Demographic Profile -- Nevada R-V School District, MO Census 2010 P.L. 94-171 Profile -- Nevada R-V School District, MO (MO0472796)
ProximityOne -- additional details and interactive ranking table  


SubjectTotal18 years and overUnder 18 years
NumberPercentNumberPercentNumberPercent
  POPULATION
  Total Population 15,264 100.0 11,515 100.0 3,749 100.0
  RACE
    One Race 15,055 98.6 11,403 99.0 3,652 97.4
      White 14,674 96.1 11,130 96.7 3,544 94.5
      Black or African American 97 0.6 70 0.6 27 0.7
      American Indian and Alaska Native 114 0.7 88 0.8 26 0.7
      Asian 93 0.6 66 0.6 27 0.7
      Native Hawaiian and Other Pacific Islander 7 0.0 3 0.0 4 0.1
      Some Other Race 70 0.5 46 0.4 24 0.6
    Two or More Races 209 1.4 112 1.0 97 2.6

  HISPANIC OR LATINO AND RACE
    Hispanic or Latino (of any race) 234 1.5 153 1.3 81 2.2
    Not Hispanic or Latino 15,030 98.5 11,362 98.7 3,668 97.8
      One Race 14,844 97.2 11,262 97.8 3,582 95.5
        White 14,544 95.3 11,045 95.9 3,499 93.3
        Black or African American 95 0.6 68 0.6 27 0.7
        American Indian and Alaska Native 102 0.7 78 0.7 24 0.6
        Asian 92 0.6 65 0.6 27 0.7
        Native Hawaiian and Other Pacific Islander 7 0.0 3 0.0 4 0.1
        Some Other Race 4 0.0 3 0.0 1 0.0
      Two or More Races 186 1.2 100 0.9 86 2.3

  HOUSING UNITS
    Total housing units 6,835 100.0    

  OCCUPANCY STATUS
      Occupied housing units 6,085 89.0    
      Vacant housing units 750 11.0    
 Data source: Census 2010, P.L. 94-171 data files.
Summary of Selected Census 2010 Demographics: Vernon County, MO

The table presented below provides a summary demographic profile for the county based on the Census 2010 P.L. 94-171 data.  Similar to a profile developed by Census, this profile also includes two columns providing characteristics for the population under 18 years of age.  These profiles are available for any Census 2010 geography, census block and higher level geography.


Census 2010 PL94171 Demographic Profile -- Vernon County, MO Census 2010 P.L. 94-171 Profile -- Vernon County, MO (MO0434852)
ProximityOne -- additional details and interactive ranking table  


SubjectTotal18 years and overUnder 18 years
NumberPercentNumberPercentNumberPercent
  POPULATION
  Total Population 21,159 100.0 15,896 100.0 5,263 100.0
  RACE
    One Race 20,864 98.6 15,731 99.0 5,133 97.5
      White 20,409 96.5 15,408 96.9 5,001 95.0
      Black or African American 102 0.5 73 0.5 29 0.6
      American Indian and Alaska Native 155 0.7 116 0.7 39 0.7
      Asian 104 0.5 73 0.5 31 0.6
      Native Hawaiian and Other Pacific Islander 8 0.0 4 0.0 4 0.1
      Some Other Race 86 0.4 57 0.4 29 0.6
    Two or More Races 295 1.4 165 1.0 130 2.5

  HISPANIC OR LATINO AND RACE
    Hispanic or Latino (of any race) 336 1.6 205 1.3 131 2.5
    Not Hispanic or Latino 20,823 98.4 15,691 98.7 5,132 97.5
      One Race 20,553 97.1 15,539 97.8 5,014 95.3
        White 20,197 95.5 15,284 96.1 4,913 93.3
        Black or African American 100 0.5 71 0.4 29 0.6
        American Indian and Alaska Native 141 0.7 105 0.7 36 0.7
        Asian 103 0.5 72 0.5 31 0.6
        Native Hawaiian and Other Pacific Islander 8 0.0 4 0.0 4 0.1
        Some Other Race 4 0.0 3 0.0 1 0.0
      Two or More Races 270 1.3 152 1.0 118 2.2

  HOUSING UNITS
    Total housing units 9,495 100.0    

  OCCUPANCY STATUS
      Occupied housing units 8,396 88.4    
      Vacant housing units 1,099 11.6    
 Data source: Census 2010, P.L. 94-171 data files.


Census 2010 Demographic Profile

The profile presented below provides a comparative analysis demographic profile for Missouri, Vernon County and Nevada city based on the Census 2010 Demographic Profile Summary File data.  This profile differs from the redistricting data profile in these ways:  there are more subject matter items available (e.g. age and household characteristics) and the profile is presented in comparative analysis format -- three areas compared side-by-side.  These profiles are available for any Census 2010 geography *down to* the city/place level (no census tracts or school districts, though these data are available in Summary File 1 when released.


Census 2010 Demographic Profile A Census 2010 Demographic Profile A
ProximityOne -- additional information  


Subject Missouri
MO-040
Vernon County
MO-050-217-99999
Nevada city
MO-160-51644
 ValuePercentValuePercentValuePercent
 GENDER AND AGE           
    Total population 5,988,927 100.0 21,159 100.0 8,386 100.0
    Under 5 years 390,237 6.5 1,464 6.9 592 7.1
    5 to 9 years 390,463 6.5 1,410 6.7 502 6.0
    10 to 14 years 396,925 6.6 1,463 6.9 522 6.2
    15 to 19 years 423,786 7.1 1,615 7.6 717 8.5
    20 to 24 years 413,289 6.9 1,161 5.5 585 7.0
    25 to 29 years 403,239 6.7 1,147 5.4 550 6.6
    30 to 34 years 372,228 6.2 1,174 5.5 464 5.5
    35 to 39 years 368,070 6.1 1,156 5.5 423 5.0
    40 to 44 years 380,546 6.4 1,260 6.0 462 5.5
    45 to 49 years 444,766 7.4 1,510 7.1 525 6.3
    50 to 54 years 443,806 7.4 1,529 7.2 514 6.1
    55 to 59 years 389,985 6.5 1,439 6.8 523 6.2
    60 to 64 years 333,293 5.6 1,355 6.4 484 5.8
    65 to 69 years 257,053 4.3 1,031 4.9 355 4.2
    70 to 74 years 193,437 3.2 756 3.6 285 3.4
    75 to 79 years 155,271 2.6 657 3.1 279 3.3
    80 to 84 years 118,754 2.0 517 2.4 278 3.3
    85 years and over 113,779 1.9 515 2.4 326 3.9
            
    Median age (years) 37.9(X) 40.0(X) 38.3(X)
            
    16 years and over 4,730,501 79.0 16,510 78.0 6,662 79.4
    18 years and over 4,563,491 76.2 15,896 75.1 6,436 76.7
    21 years and over 4,300,988 71.8 14,927 70.5 5,880 70.1
    62 years and over 1,030,757 17.2 4,277 20.2 1,807 21.5
    65 years and over 838,294 14.0 3,476 16.4 1,523 18.2
            
    Male population 2,933,477 49.0 10,269 48.5 3,803 45.3
    Under 5 years 199,528 3.3 769 3.6 304 3.6
    5 to 9 years 199,591 3.3 739 3.5 269 3.2
    10 to 14 years 203,213 3.4 754 3.6 266 3.2
    15 to 19 years 216,939 3.6 761 3.6 287 3.4
    20 to 24 years 207,793 3.5 544 2.6 233 2.8
    25 to 29 years 201,438 3.4 550 2.6 270 3.2
    30 to 34 years 186,306 3.1 593 2.8 229 2.7
    35 to 39 years 183,144 3.1 561 2.7 205 2.4
    40 to 44 years 188,854 3.2 610 2.9 217 2.6
    45 to 49 years 220,099 3.7 757 3.6 267 3.2
    50 to 54 years 218,081 3.6 746 3.5 250 3.0
    55 to 59 years 188,437 3.1 706 3.3 239 2.8
    60 to 64 years 159,520 2.7 657 3.1 221 2.6
    65 to 69 years 121,239 2.0 489 2.3 155 1.8
    70 to 74 years 88,753 1.5 346 1.6 109 1.3
    75 to 79 years 67,506 1.1 301 1.4 118 1.4
    80 to 84 years 47,180 0.8 213 1.0 75 0.9
    85 years and over 35,856 0.6 173 0.8 89 1.1
            
    Median age (years) 36.5(X) 39.0(X) 36.0(X)
            
    16 years and over 2,289,523 38.2 7,856 37.1 2,904 34.6
    18 years and over 2,203,779 36.8 7,529 35.6 2,784 33.2
    21 years and over 2,070,483 34.6 7,149 33.8 2,628 31.3
    62 years and over 452,502 7.6 1,911 9.0 678 8.1
    65 years and over 360,534 6.0 1,522 7.2 546 6.5
            
    Female population 3,055,450 51.0 10,890 51.5 4,583 54.7
    Under 5 years 190,709 3.2 695 3.3 288 3.4
    5 to 9 years 190,872 3.2 671 3.2 233 2.8
    10 to 14 years 193,712 3.2 709 3.4 256 3.1
    15 to 19 years 206,847 3.5 854 4.0 430 5.1
    20 to 24 years 205,496 3.4 617 2.9 352 4.2
    25 to 29 years 201,801 3.4 597 2.8 280 3.3
    30 to 34 years 185,922 3.1 581 2.7 235 2.8
    35 to 39 years 184,926 3.1 595 2.8 218 2.6
    40 to 44 years 191,692 3.2 650 3.1 245 2.9
    45 to 49 years 224,667 3.8 753 3.6 258 3.1
    50 to 54 years 225,725 3.8 783 3.7 264 3.1
    55 to 59 years 201,548 3.4 733 3.5 284 3.4
    60 to 64 years 173,773 2.9 698 3.3 263 3.1
    65 to 69 years 135,814 2.3 542 2.6 200 2.4
    70 to 74 years 104,684 1.7 410 1.9 176 2.1
    75 to 79 years 87,765 1.5 356 1.7 161 1.9
    80 to 84 years 71,574 1.2 304 1.4 203 2.4
    85 years and over 77,923 1.3 342 1.6 237 2.8
            
    Median age (years) 39.2(X) 41.2(X) 40.0(X)
            
    16 years and over 2,440,978 40.8 8,654 40.9 3,758 44.8
    18 years and over 2,359,712 39.4 8,367 39.5 3,652 43.5
    21 years and over 2,230,505 37.2 7,778 36.8 3,252 38.8
    62 years and over 578,255 9.7 2,366 11.2 1,129 13.5
    65 years and over 477,760 8.0 1,954 9.2 977 11.7
            
 RACE           
    Total population 5,988,927 100.0 21,159 100.0 8,386 100.0
        One Race 5,864,338 97.9 20,864 98.6 8,256 98.4
            White 4,958,770 82.8 20,409 96.5 7,976 95.1
            Black or African American 693,391 11.6 102 0.5 91 1.1
            American Indian and Alaska Native 27,376 0.5 155 0.7 67 0.8
            Asian 98,083 1.6 104 0.5 66 0.8
            Asian Indian 23,223 0.4 14 0.1 10 0.1
            Chinese 22,104 0.4 18 0.1 14 0.2
            Filipino 10,914 0.2 14 0.1 6 0.1
            Japanese 3,186 0.1 13 0.1 9 0.1
            Korean 9,249 0.2 8 0.0 3 0.0
            Vietnamese 14,523 0.2 18 0.1 14 0.2
            Other Asian [1] 14,884 0.2 19 0.1 10 0.1
            Native Hawaiian and Other Pacific Islander 6,261 0.1 8 0.0 3 0.0
            Native Hawaiian 958 0.0 4 0.0 0 0.0
            Guamanian or Chamorro 969 0.0 0 0.0 0 0.0
            Samoan 1,557 0.0 3 0.0 2 0.0
            Other Pacific Islander [2] 2,777 0.0 1 0.0 1 0.0
            Some Other Race 80,457 1.3 86 0.4 53 0.6
        Two or More Races 124,589 2.1 295 1.4 130 1.6
            White; American Indian and Alaska Native [3] 33,738 0.6 187 0.9 71 0.8
            White; Asian [3] 18,604 0.3 22 0.1 11 0.1
            White; Black or African American [3] 39,037 0.7 50 0.2 27 0.3
            White; Some Other Race [3] 10,728 0.2 12 0.1 7 0.1
            
 Race alone or in combination with other races: [4]           
            White 5,070,826 84.7 20,693 97.8 8,098 96.6
            Black or African American 747,474 12.5 160 0.8 121 1.4
            American Indian and Alaska Native 72,376 1.2 353 1.7 143 1.7
            Asian 123,571 2.1 134 0.6 85 1.0
            Native Hawaiian and Other Pacific Islander 11,296 0.2 15 0.1 5 0.1
            Some Other Race 96,920 1.6 107 0.5 68 0.8
            
 HISPANIC OR LATINO           
    Total population 5,988,927 100.0 21,159 100.0 8,386 100.0
        Hispanic or Latino (of any race) 212,470 3.5 336 1.6 167 2.0
            Mexican 147,254 2.5 242 1.1 127 1.5
            Puerto Rican 12,236 0.2 16 0.1 7 0.1
            Cuban 4,979 0.1 3 0.0 3 0.0
            Other Hispanic or Latino [5] 48,001 0.8 75 0.4 30 0.4
        Not Hispanic or Latino 5,776,457 96.5 20,823 98.4 8,219 98.0
            
 HISPANIC OR LATINO AND RACE           
    Total population 5,988,927 100.0 21,159 100.0 8,386 100.0
        Hispanic or Latino 212,470 3.5 336 1.6 167 2.0
            White alone 108,022 1.8 212 1.0 92 1.1
            Black or African American alone 6,242 0.1 2 0.0 2 0.0
            American Indian and Alaska Native alone 3,314 0.1 14 0.1 7 0.1
            Asian alone 862 0.0 1 0.0 0 0.0
            Native Hawaiian and Other Pacific Islander alone 498 0.0 0 0.0 0 0.0
            Some Other Race alone 75,085 1.3 82 0.4 49 0.6
            Two or More Races 18,447 0.3 25 0.1 17 0.2
        Not Hispanic or Latino 5,776,457 96.5 20,823 98.4 8,219 98.0
            White alone 4,850,748 81.0 20,197 95.5 7,884 94.0
            Black or African American alone 687,149 11.5 100 0.5 89 1.1
            American Indian and Alaska Native alone 24,062 0.4 141 0.7 60 0.7
            Asian alone 97,221 1.6 103 0.5 66 0.8
            Native Hawaiian and Other Pacific Islander alone 5,763 0.1 8 0.0 3 0.0
            Some Other Race alone 5,372 0.1 4 0.0 4 0.0
            Two or More Races 106,142 1.8 270 1.3 113 1.3
            
 RELATIONSHIP           
    Total population 5,988,927 100.0 21,159 100.0 8,386 100.0
        In households 5,814,785 97.1 20,293 95.9 7,550 90.0
            Householder 2,375,611 39.7 8,396 39.7 3,491 41.6
            Spouse [6] 1,150,929 19.2 4,317 20.4 1,255 15.0
            Child 1,672,430 27.9 5,728 27.1 2,005 23.9
            Own child under 18 years 1,263,106 21.1 4,587 21.7 1,634 19.5
            Other relatives 287,911 4.8 899 4.2 335 4.0
            Under 18 years 125,635 2.1 421 2.0 152 1.8
            65 years and over 36,495 0.6 96 0.5 32 0.4
            Nonrelatives 327,904 5.5 953 4.5 464 5.5
            Under 18 years 29,729 0.5 121 0.6 52 0.6
            65 years and over 12,278 0.2 50 0.2 21 0.3
            
            Unmarried partner 159,237 2.7 527 2.5 241 2.9
        In group quarters 174,142 2.9 866 4.1 836 10.0
            Institutionalized population 93,274 1.6 451 2.1 428 5.1
            Male 57,397 1.0 217 1.0 215 2.6
            Female 35,877 0.6 234 1.1 213 2.5
            Noninstitutionalized population 80,868 1.4 415 2.0 408 4.9
            Male 43,507 0.7 81 0.4 78 0.9
            Female 37,361 0.6 334 1.6 330 3.9
            
 HOUSEHOLDS BY TYPE           
    Total households 2,375,611 100.0 8,396 100.0 3,491 100.0
        Family households (families) [7] 1,552,133 65.3 5,539 66.0 1,908 54.7
            With own children under 18 years 676,727 28.5 2,344 27.9 880 25.2
            Husband-wife family 1,150,929 48.4 4,317 51.4 1,255 35.9
            With own children under 18 years 449,855 18.9 1,589 18.9 449 12.9
            Male householder, no wife present 109,000 4.6 367 4.4 161 4.6
            With own children under 18 years 58,729 2.5 225 2.7 96 2.7
            Female householder, no husband present 292,204 12.3 855 10.2 492 14.1
            With own children under 18 years 168,143 7.1 530 6.3 335 9.6
        Nonfamily households [7] 823,478 34.7 2,857 34.0 1,583 45.3
            Householder living alone 672,276 28.3 2,466 29.4 1,408 40.3
            Male 298,358 12.6 1,071 12.8 524 15.0
            65 years and over 67,247 2.8 290 3.5 125 3.6
            Female 373,918 15.7 1,395 16.6 884 25.3
            65 years and over 172,744 7.3 741 8.8 471 13.5
            
        Households with individuals under 18 years 754,287 31.8 2,609 31.1 986 28.2
        Households with individuals 65 years and over 595,032 25.0 2,411 28.7 1,041 29.8
            
        Average household size 2.50(X) 2.40(X) 2.20(X)
        Average family size [7] 3.00(X) 2.98(X) 2.88(X)
            
 HOUSING OCCUPANCY           
    Total housing units 2,712,729 100.0 9,495 100.0 4,018 100.0
        Occupied housing units 2,375,611 87.6 8,396 88.4 3,491 86.9
        Vacant housing units 337,118 12.4 1,099 11.6 527 13.1
            For rent 92,946 3.4 417 4.4 306 7.6
            Rented, not occupied 4,290 0.2 23 0.2 14 0.3
            For sale only 44,200 1.6 129 1.4 79 2.0
            Sold, not occupied 11,098 0.4 97 1.0 60 1.5
            For seasonal, recreational, or occasional use 80,374 3.0 111 1.2 10 0.2
            All other vacants 104,210 3.8 322 3.4 58 1.4
            
        Homeowner vacancy rate (percent) [8] 2.60(X) 2.10(X) 4.00(X)
        Rental vacancy rate (percent) [9] 11.10(X) 14.20(X) 15.50(X)
            
 HOUSING TENURE           
    Occupied housing units 2,375,611 100.0 8,396 100.0 3,491 100.0
        Owner-occupied housing units 1,633,610 68.8 5,907 70.4 1,838 52.6
            Population in owner-occupied housing units 4,145,569(X) 14,695(X) 4,094(X)
            Average household size of owner-occupied units 2.54(X) 2.49(X) 2.23(X)
        Renter-occupied housing units 742,001 31.2 2,489 29.6 1,653 47.4
            Population in renter-occupied housing units 1,669,216(X) 5,598(X) 3,456(X)
            Average household size of renter-occupied units 2.25(X) 2.25(X) 2.09(X)
 
 
 Data source: Census 2010.


Children's Demographics by Type of Enrollment


This profile presented below shows age distributions for the district by type of enrollment universe.

Data centric to mid-2007 are based on the ACS 2009 School District Special Tabulation released May 2011.


School District Special Tabulation Profile -- Nevada R-V School District MO (2921840)
ProximityOne -- additional information; see notes below table
Total PopulationTotal ChildrenGrade Relevant ChildrenGRC: EnrolledGRC: Enrolled PublicGRC: Enrolled PrivateGRC: Not Enrolled
ValuePercentValuePercentValuePercentValuePercentValuePercentValuePercentValuePercentPercent
Total 14,322 100.00 3,870 100.00 3,165 100.00 2,945 100.00 2,585 100.00 360 100.00 220 100.00 6.95
Age 0-4 985 6.88 985 25.45 280 8.85 155 5.26 110 4.26 45 12.50 125 56.82 3.95
Age 5-9 992 6.93 995 25.71 995 31.44 945 32.09 795 30.75 150 41.67 50 22.73 1.58
Age 10-14 1,126 7.86 1,130 29.20 1,130 35.70 1,130 38.37 1,005 38.88 125 34.72 0 0.00 0.00
Age 15-17 667 4.66 670 17.31 670 21.17 660 22.41 615 23.79 45 12.50 10 4.55 0.32
Age 18-19 551 3.85 105 2.71 105 3.32 60 2.04 60 2.32 0 0.00 45 20.45 1.42
Age 20 77 0.54
Age 21 191 1.33
Age 22-24 554 3.87
Age 25-29 829 5.79
Age 30-34 753 5.26
Age 35-39 829 5.79
Age 40-44 903 6.30
Age 45-49 1,129 7.88
Age 50-54 884 6.17
Age 55-59 846 5.91
Age 60-61 311 2.17
Age 62-64 538 3.76
Age 65-66 268 1.87
Age 67-69 369 2.58
Age 70-74 407 2.84
Age 75-79 400 2.79
Age 80-84 405 2.83
Age 85up 308 2.15
GRC: Grade Relevant Population
Data source: U.S. Department of Education; Bureau of the Census; 2009 American Community Survey SDST.
Developed by ProximityOne -- http://proximityone.com.
These data are derived from SDST Table B01001 -- gender by age for each tabulation universe.

The table presented above shows two data columns for each SDST tabulation universe:
  Total population -- all ages
  Total children -- ages 0-19; 18 & 19 not high school graduate
  Grade relevant children -- Total **
  Grade relevant children -- Enrolled and not enrolled **
  Grade relevant children -- Enrolled **
  Grade relevant children -- Enrolled public **
  Grade relevant children -- Enrolled private **
  Grade relevant children -- Not enrolled (RCNE) **
  ** ages 3-19; 18 & 19 not high school graduate and ages grade relevant to those offered by district; e.g. K-5 or K-12

The two leftmost data columns provide data for the total population and show data for all ages.
All other column sets to the right provide only data for population under 19 years by universe definition.


Census 2000 Demographic Profiles for Nevada R-V School District (RTF will open in Word)

DP1 - General Demographics ... XLS ... RTF
DP2 - Social Characteristics ... XLS ... RTF
DP3 - Economic Characteristics ... XLS ... RTF
DP4 - Housing Characteristics ... XLS ... RTF


Note that DP1 equivalent data are available from Census 2010.  DP2-DP4 data are not available from Census 2010 as these subject matter were not included in Census 2010.  DP1-DP4 similar data are available census tract level and up from ACS 2009 5-year demographics.


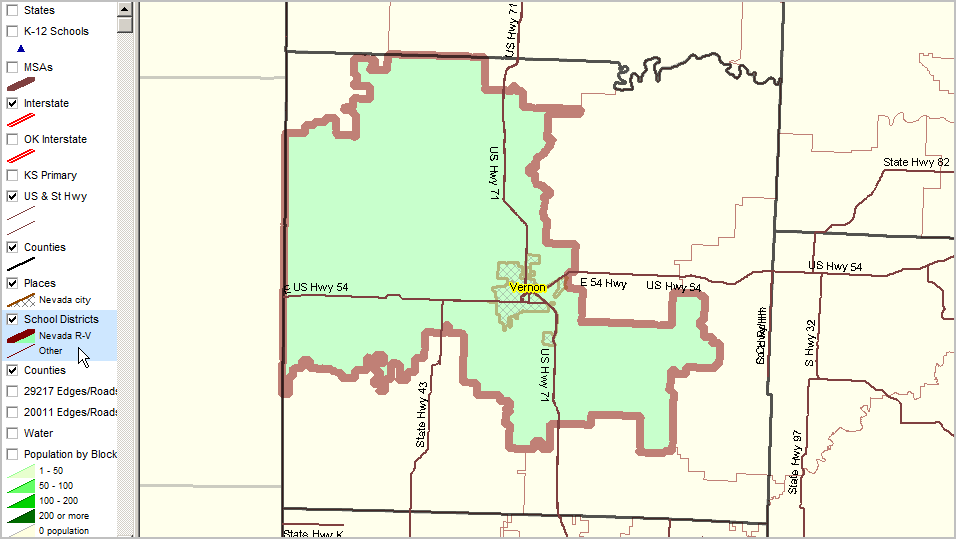
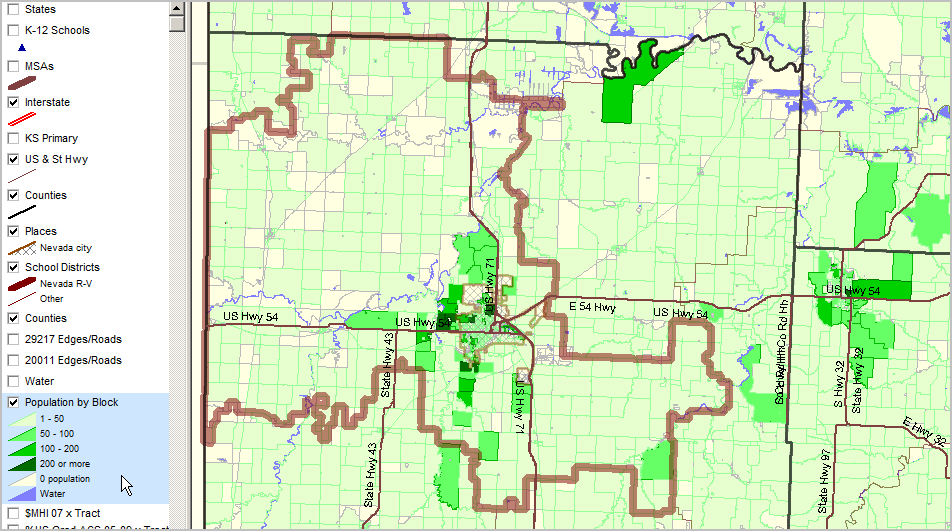
The GIS project fileset used to develop the views shown below is available for your use.  Add your own data; create alternative views.  We can also provide custom map views or analyses to meet your needs. Contact us for details (888-364-7656).


Nevada in Regional Context


Nevada R-V School District bold brown boundary green fill pattern.

Nevada city diagonal cross-hatch pattern.


Patterns of Economic Prosperity -- Median Household Income by Census Tract


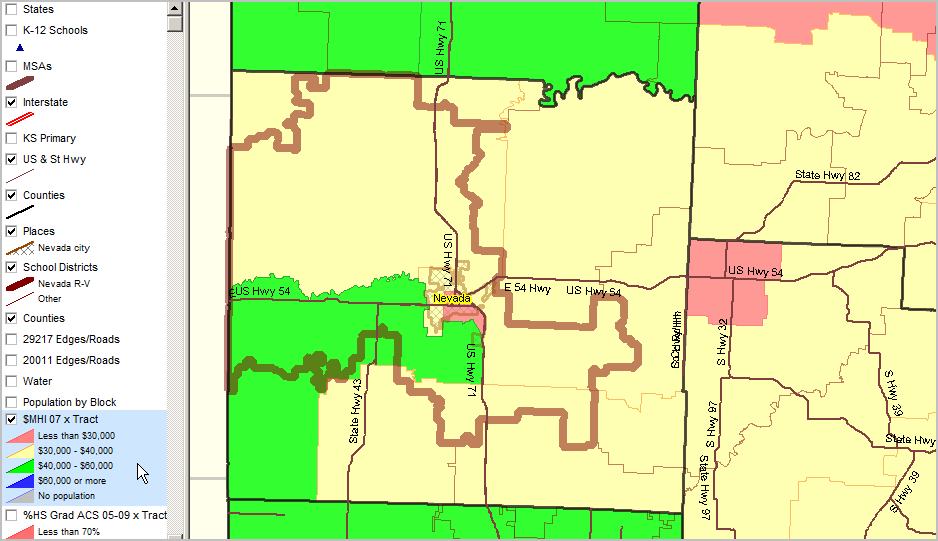
Median Household Income ACS 2005-09 (mid-2007)

... using ACS census tract estimates released December 2010 (http://proximityone.com/acs.htm).

See highlighted (blue) layer in legend (left of map) for color/data value interval definitions.


Patterns of Educational Attainment by Census Tract


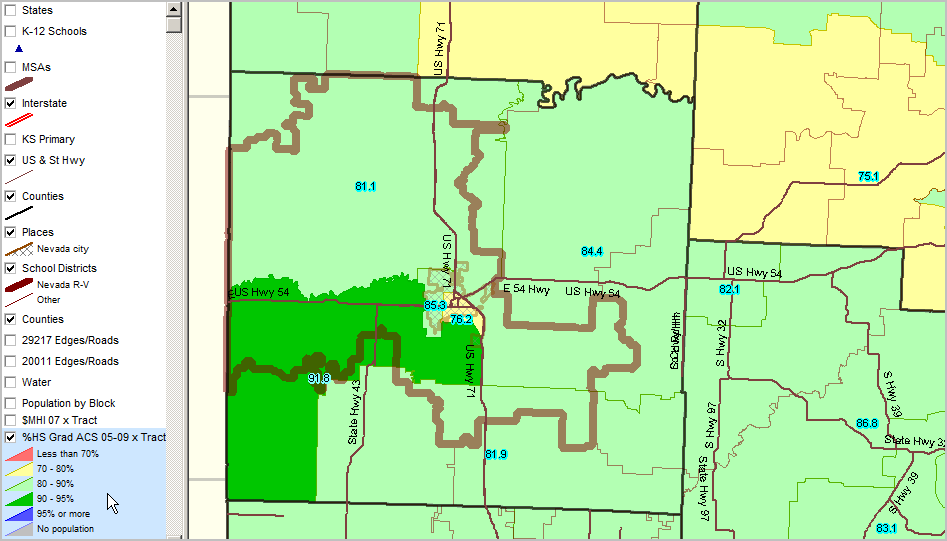
Percent high school graduate (population 25 years and over) by school district.

Data based on 2009 American Community Survey (http://proximityone.com/acs.htm) 5-year estimates, centric to mid-2007.

See highlighted (blue) layer in legend (left of map) for color/data value interval definitions.


Patterns of Census 2010 Total Population Distribution by Census Block


See highlighted (blue) layer in legend (left of map) for color/data value interval definitions.

More about these data: http://proximityone.com/cen2010_blocks.htm.


Zoom-in View: Patterns of Census 2010 Total Population by Census Block


View similar to above showing total population by block as label.

Intersection-to-intersection street detail and K-12 schools shown.


Site Analysis: Patterns of Census 2010 Population by Census Block

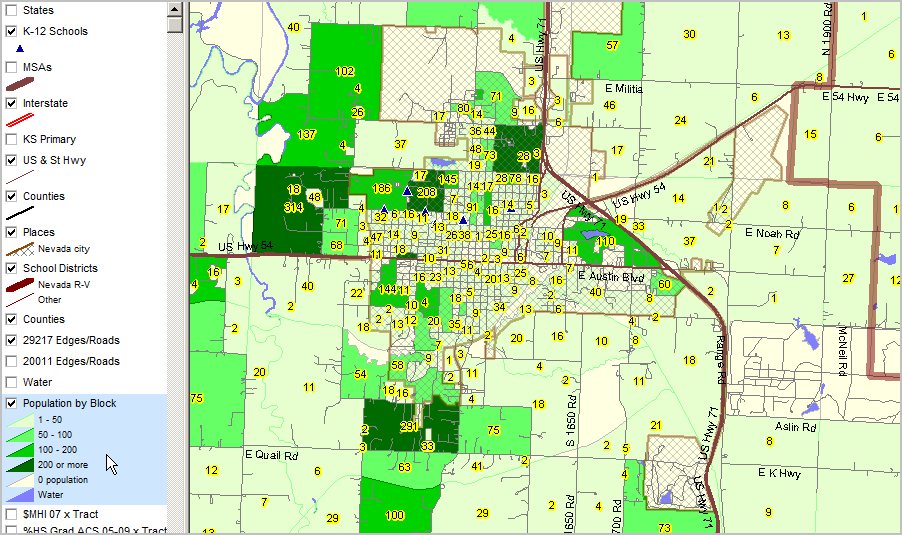
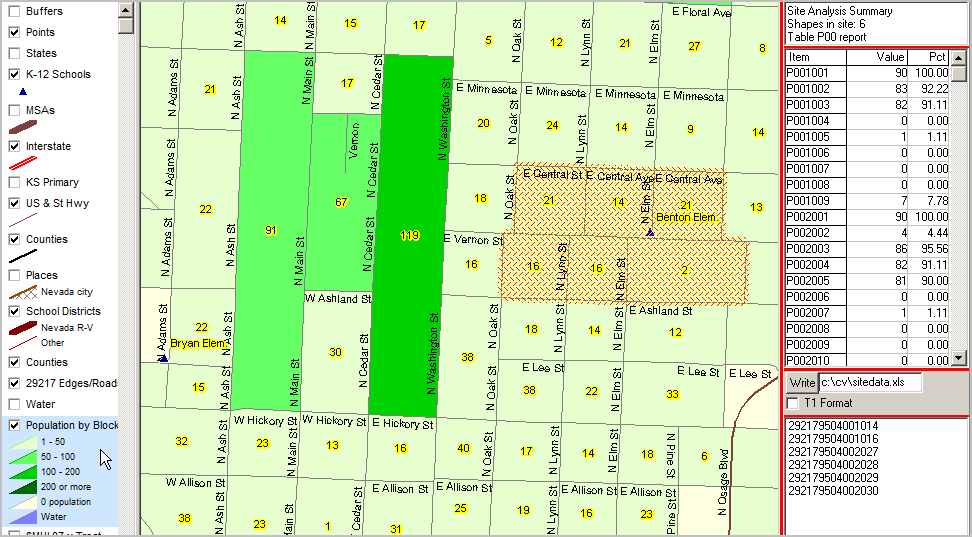
Further zoom-in ...

CV Site Analysis operation applied to census block layer; blocks "cherry-picked" in vicinity of school.

In the graphic below, table in upper right shows 6 blocks (cross-hatched) in this study area.


Aggregate demographics for selected blocks are shown in the mini table below that count:

90 total population in this set of blocks (p001001); 82 "White population of one race" (p001003) in this set of blocks.

4 Hispanic (p002002) and 86 non-Hispanic (p002003)

Item names shown in left column of profile defined at http://proximityone.com/cen2010_blocks.htm.


List of geocodes for blocks included shown in lower right mini table.

By clicking "Write" button, the summary data are written to specified spreadsheet file.

ProximityOne -- resources to create and apply insights © ProximityOne