Warrensburg, MO

Contents
Selected CommunityViewer project/application views in Missouri.
Click toggle in Table of Contents at left to view sub-state applications.
Integrating Census 2010 TIGER Shapefiles, ACS 2009 5-year demographics, Census 2010 demographics and related data..
See related interactive ranking tables:
| • | Missouri school district demographics: http://proximityone.com/sd_mo.htm. |
| • | Missouri census tract demographics: http://proximityone.com/ustr0509_mo.htm. |
| • | Census 2010 demographics: http://proximityone.com/cen2010_pl94171.htm |
(all US geography: state, congressional district, county, school district, city/place, metro)
The GIS project fileset used to develop the views shown below is available for your use. Add your own data; create alternative views. We can also provide custom map views or analyses to meet your needs. Contact us for details (888-364-7656).
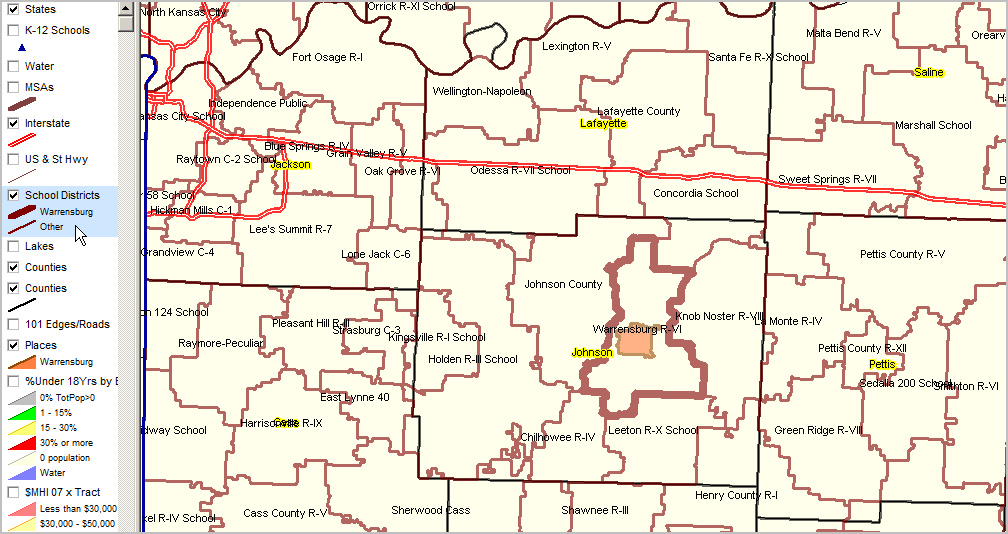
Warrensburg School District, MO located in Johnson County. Warrensburg School District bold brown boundary.
|
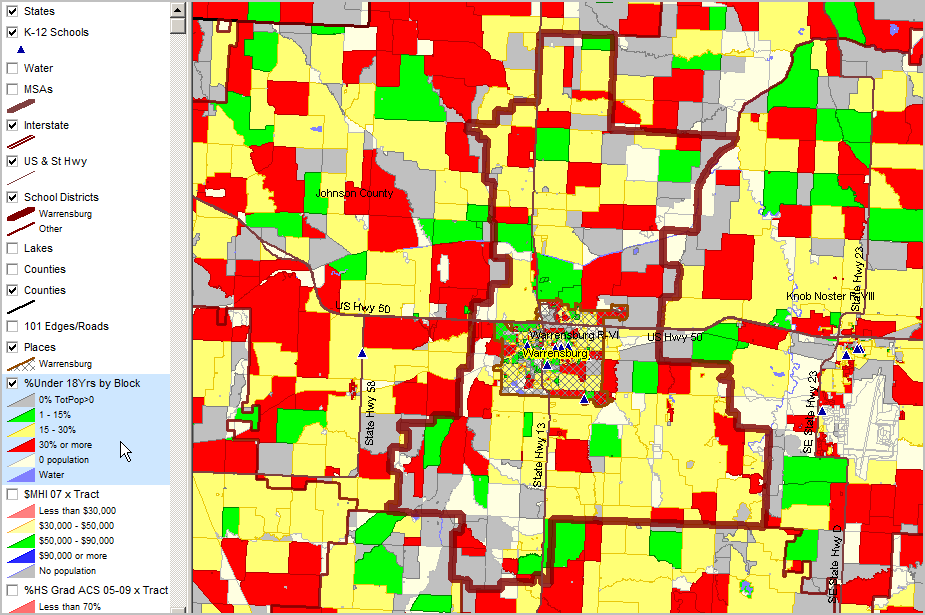
K-12 schools blue triangle markers. Warrensburg School District bold brown boundary. Warrensburg city semi-transparent diagonal cross-hatch pattern. See highlighted (blue) layer in legend (left of map) for color/data value interval definitions. More about these data: http://proximityone.com/cen2010_blocks.htm.
|
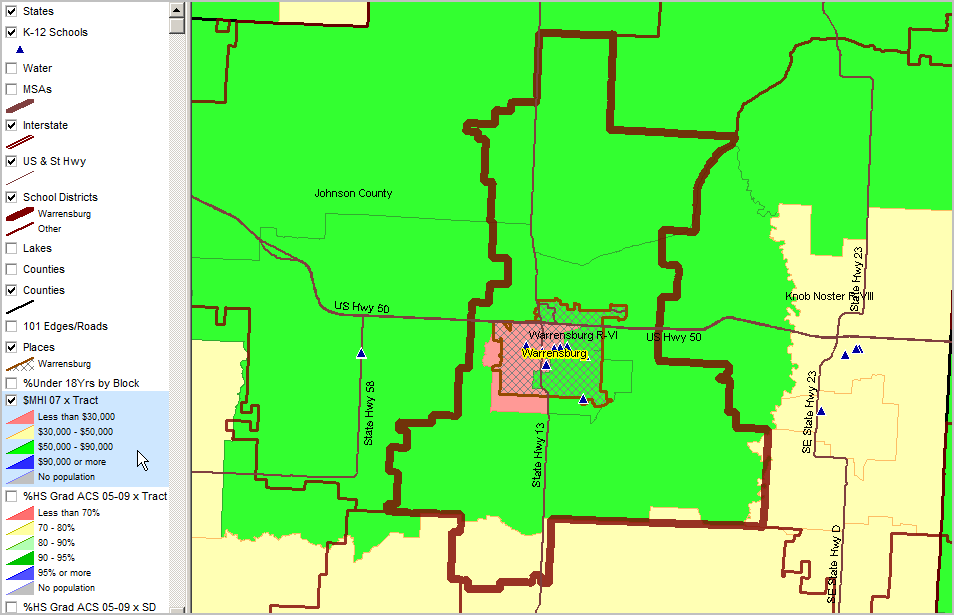
Median Household Income ACS 2005-09 (mid-2007) ... using ACS census tract estimates released December 2010 (http://proximityone.com/acs.htm). See highlighted (blue) layer in legend (left of map) for color/data value interval definitions.
|
Educational Attainment by Census Tract Percent high school graduate (population 25 years and over) by census tract. Data based on 2009 American Community Survey (http://proximityone.com/acs.htm) 5-year estimates, centric to mid-2007. See highlighted (blue) layer in legend (left of map) for color/data value interval definitions.
|

K-12 schools blue triangle markers. See highlighted (blue) layer in legend (left of map) for color/data value interval definitions.
CV Identify tool used to show profile for selected (see pointer) census block. Item names show in left column of profile defined at http://proximityone.com/cen2010_blocks.htm. Data values for items, for this block, shown in right column. Alternative thematic map/pattern views could be based on any of these items.
|
