Richmond Area

Contents
Selected CommunityViewer project/application views in Virginia.
Click toggle in Table of Contents at left to view sub-state applications.
Integrating Census 2010 TIGER Shapefiles, ACS 2009 5-year demographics, Census 2010 demographics and related data.
See related interactive ranking tables:
| • | Virginia school district demographics: http://proximityone.com/sd_va.htm. |
| • | Virginia census tract demographics: http://proximityone.com/ustr0509_va.htm. |
| • | Census 2010 demographics: http://proximityone.com/cen2010_pl94171.htm |
(all US geography: state, congressional district, county, school district, city/place, metro)
Selected Richmond Area Views
More about metros and Situation & Outlook
| • | Metropolitan Area Guide: http://proximityone.com/metros/guide |
| • | MetroView: demographic-economic profiles & patterns -- http://proximityone.com/metroview.htm |
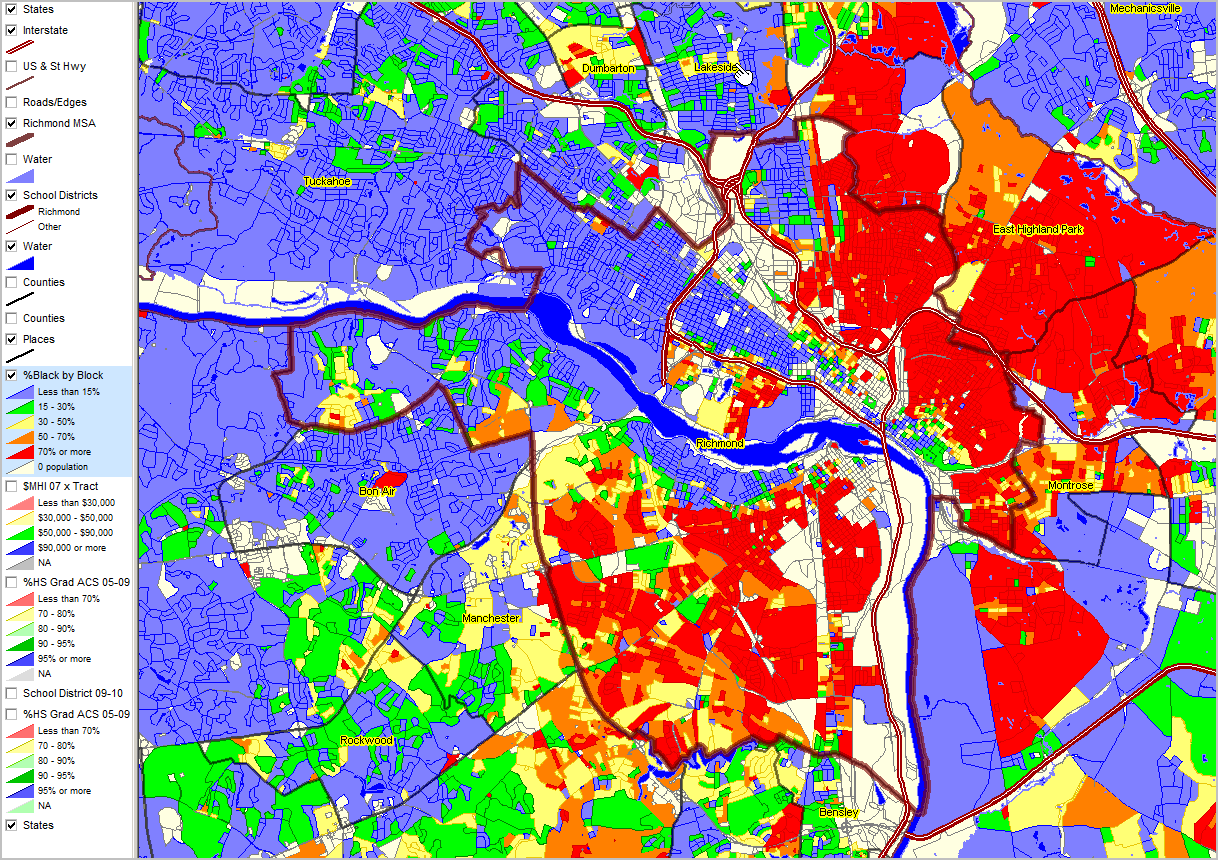
See highlighted (blue) layer in legend (left of map) for color/data value interval definitions. More about these data: http://proximityone.com/cen2010_blocks.htm.
Richmond city (coterminous with school district) bold red-brown semi-transparent boundary. CDP (Census Designated Places) shown with black boundary and yellow label. Next view shows zoom-in to Lakeside CDP north of Richmond city (see pointer) to illustrate drilldown.
|
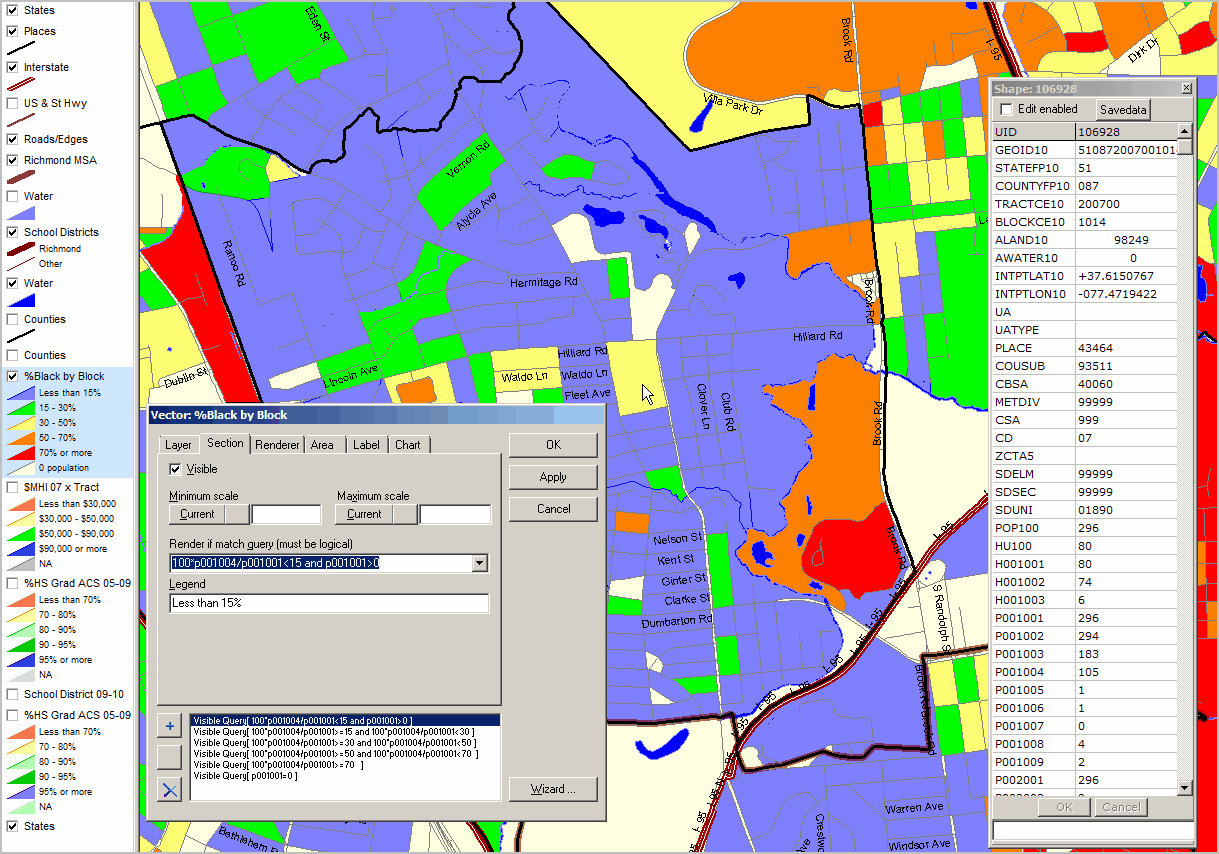
| Richmond, VA Area -- Census 2010 Percent Black/African American by Census Block -- Lakeside CDP Area |
Lakeside CDP located north of Richmond city in Henrico County (see pointer/hand previous view)
Illustrates use of CV GIS identify tool to profile selected census block (see pointer in map). Illustrates use of CV GIS layer editor to dynamically make computations and set intervals for thematic map. (eg., interval 1 is percent Black computation set to less than 15 percent 100*p001004/p001001<15) Profile shows this block (geocode 51-087-200700-1014) has 105 Black/African American (item p001004, Census 2010, "of 1 race") of 296 total population (p001001)
|
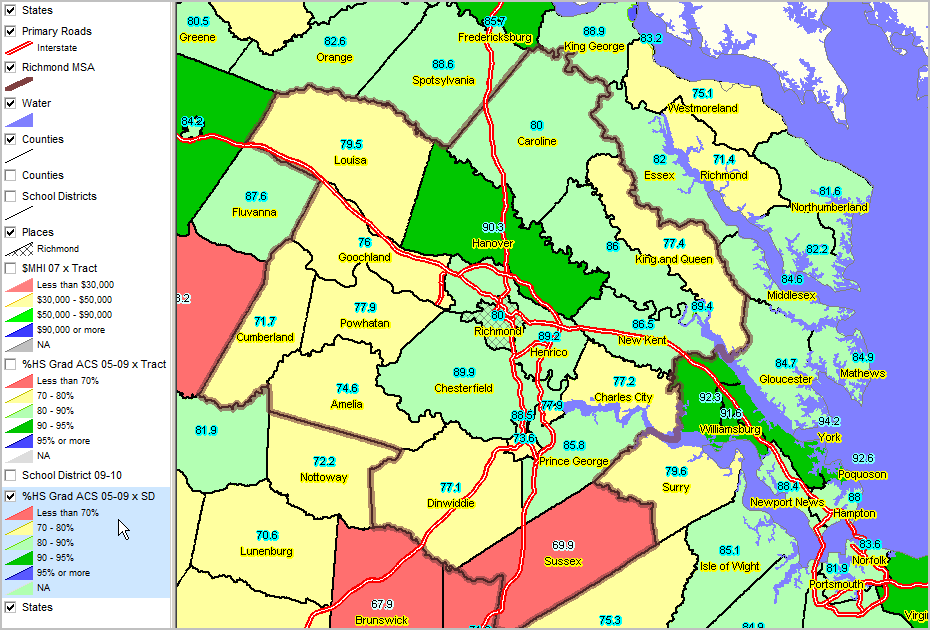
Educational Attainment by School District Percent high school graduate (population 25 years and over) by school district. Data based on 2009 American Community Survey (http://proximityone.com/acs.htm) 5-year estimates, centric to mid-2007.
Richmond Metro bold brown boundary Richmond city shown with cross-hatch pattern
|
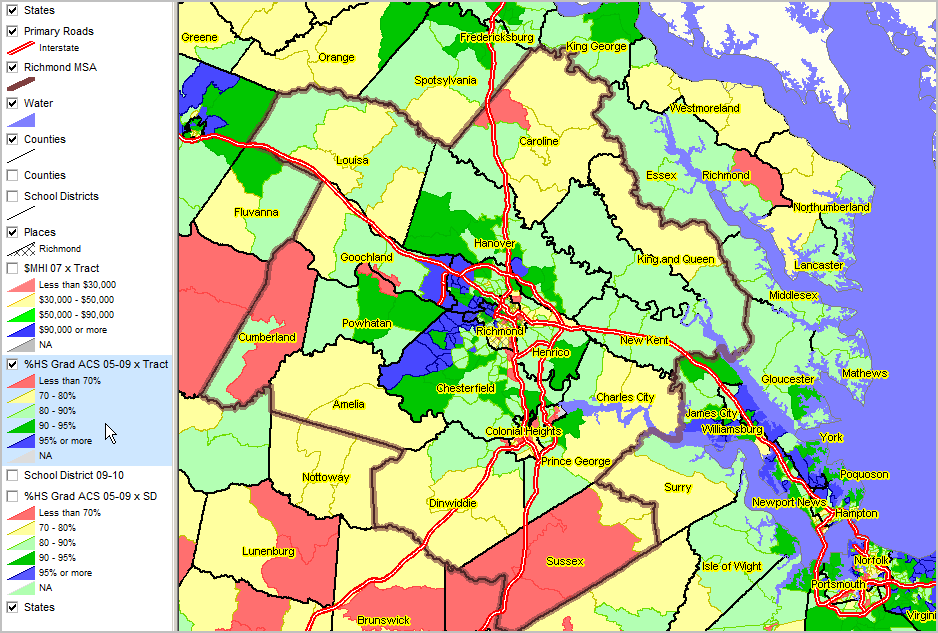
Educational Attainment by Census Tract Percent high school graduate (population 25 years and over) by census tract. Data based on 2009 American Community Survey (http://proximityone.com/acs.htm) 5-year estimates, centric to mid-2007.
Richmond Metro bold brown boundary Richmond city shown with cross-hatch pattern
|
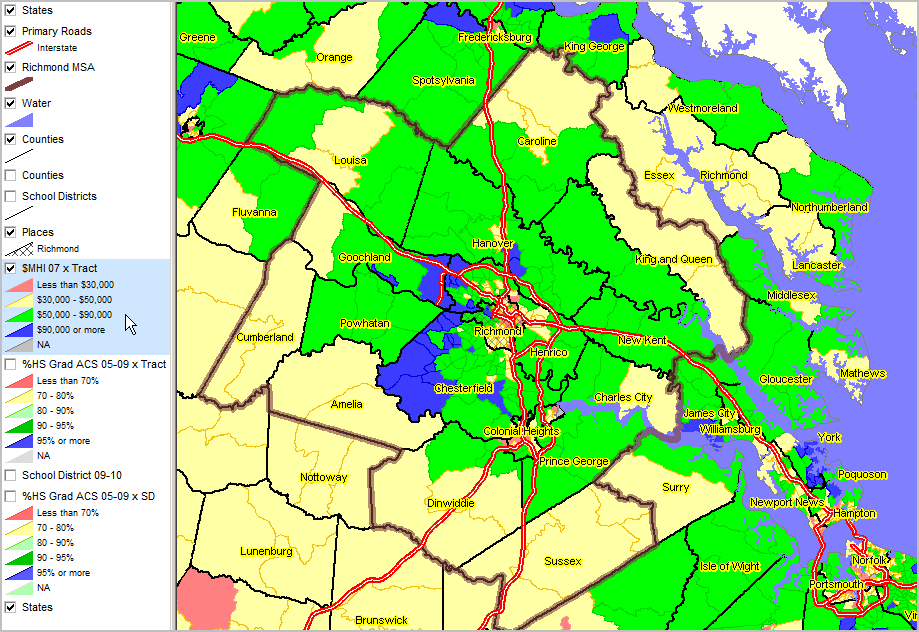
Median Household Income ACS 2005-09 (mid-2007) ... using ACS census tract estimates released December 2010 (http://proximityone.com/acs.htm).
Richmond Metro bold brown boundary Richmond city shown with cross-hatch pattern
|
Median Household Income ACS 2005-09 (mid-2007) ... using ACS census tract estimates released December 2010 (http://proximityone.com/acs.htm).
Richmond city shown with cross-hatch pattern County/county-equivalent areas shown with bold black boundary
|
