Seattle Area

Contents
Selected CommunityViewer project/application views in Washington.
Click toggle in Table of Contents at left to view sub-state applications.
Integrating Census 2010 TIGER Shapefiles, ACS 2009 5-year demographics, Census 2010 demographics and related data..
See related interactive ranking tables:
| • | Washington school district demographics: http://proximityone.com/sd_wa.htm. |
| • | Washington census tract demographics: http://proximityone.com/ustr0509_wa.htm. |
| • | Census 2010 demographics: http://proximityone.com/cen2010_pl94171.htm |
(all US geography: state, congressional district, county, school district, city/place, metro)
Selected Seattle Area Views
More about metros and Situation & Outlook
| • | Metropolitan Area Guide: http://proximityone.com/metros/guide |
| • | MetroView: demographic-economic profiles & patterns -- http://proximityone.com/metroview.htm |
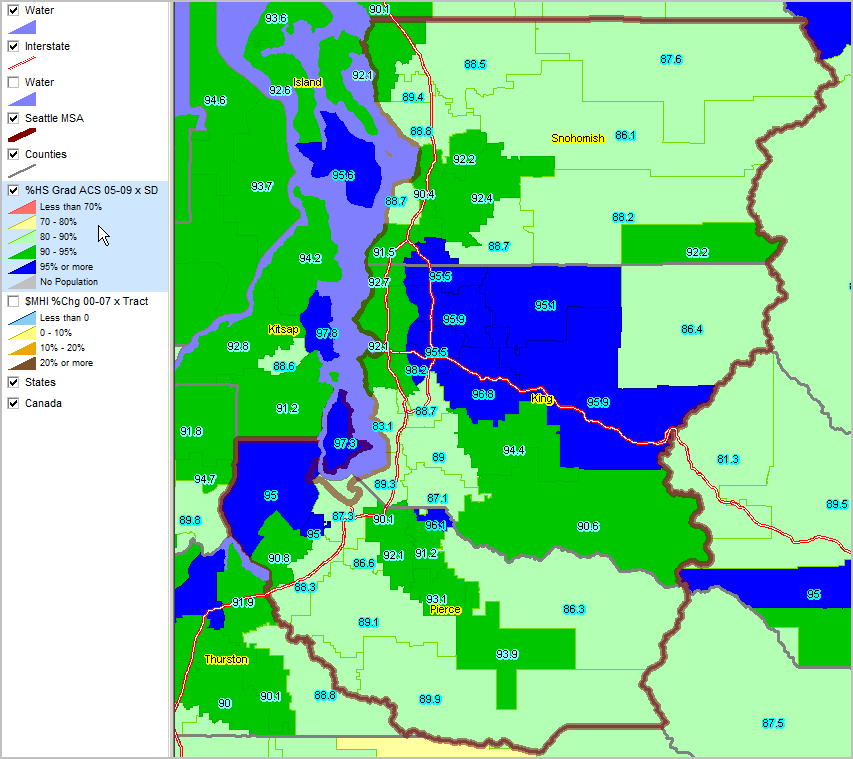
Educational Attainment by School District
Percent high school graduate (population 25 years and over) by school district.
Data based on 2009 American Community Survey (http://proximityone.com/acs.htm) 5-year estimates, centric to mid-2007.
See related ranking table http://proximityone.com/sd_wa.htm.
3 county Seattle, WA MSA shown by brown boundary.
See color patterns in highlighted layer in legend at left of map view.
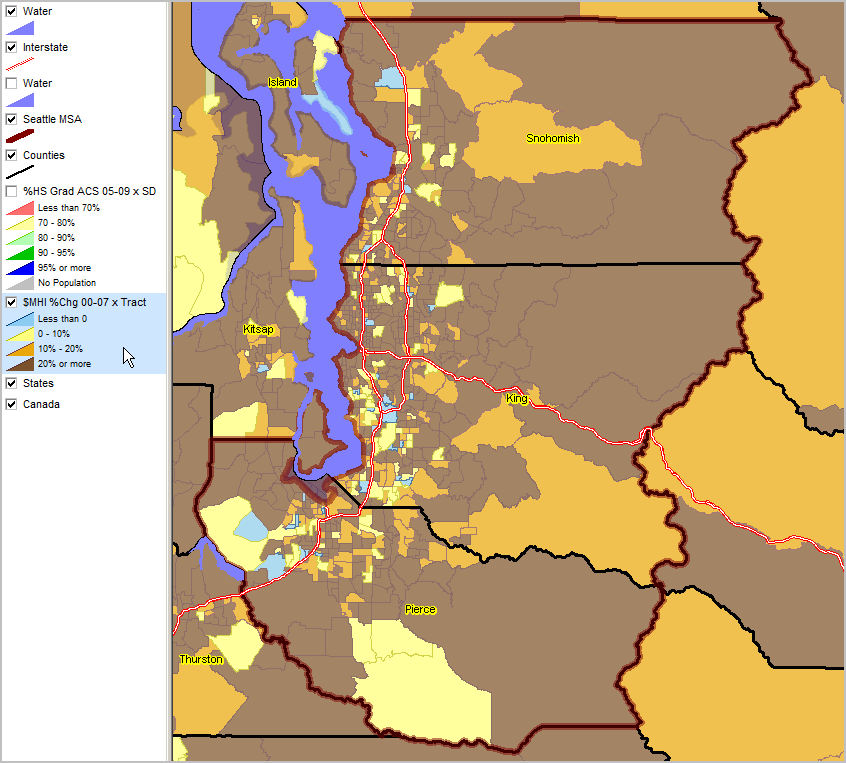
Median Household Income, Percent change 2000 to 2007, by Census Tract
Data based on Census 2000 and 2009 ACS (http://proximityone.com/acs.htm) 5-year estimates, centric to mid-2007.
See $MHI by census tract in ranking table http://proximityone.com/ustr0509_or.htm.
3 county Seattle, WA MSA shown by brown boundary.
See color patterns in highlighted layer in legend at left of map view.