|
|
|
Missouri School District SocioEconomic Status & Challenge Factors This section presents views of SocioEconomic Status (SES) measures for Missouri School Districts. SES measures help us understand the nature and relative magnitude of "challenge factors" facing school districts. These maps have been developed through the use of the Proximity SDViewer (School District Viewer). The SDViewer software and database may be used to achieve maximum flexibility in viewing characteristics of schools and school districts in regions of interest. See related pattern analyses using SDViewer summarized at sdpatterns.htm and sdpatternssch.htm. Views presented below are organized by larger urbanized areas of the State. The first view presents a graphical depiction of the set of SES measures, at the school district level, summarized at sdviewerses.htm. The red bar is the Missouri statewide normed value of 100 and is of constant height (exceptions). The indices for the 5 SES measures also appear in each bar chart. The mix of “SES challenge factors” that each district has can easily be seen. Districts with ascending bars, left to right in the bar chart have relatively more SES challenge factors across the board. Districts with descending bars, left to right in the bar chart, have relatively less overall SES challenge factors. Columbia-Jefferson City Area (click image for larger view; expand browser to full screen; F11 key for IE) 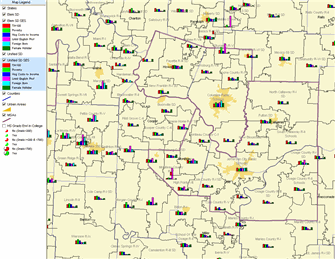
Urban areas (urbanized areas and urban clusters) appear as a light orange. Kansas City Area (click image for larger view; expand browser to full screen; F11 key for IE) 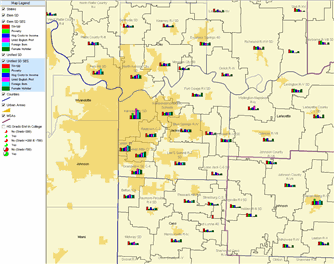
St. Louis Area (click image for larger view; expand browser to full screen; F11 key for IE) 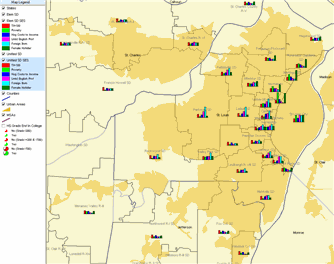
Springfield-Joplin Area (click image for larger view; expand browser to full screen; F11 key for IE) 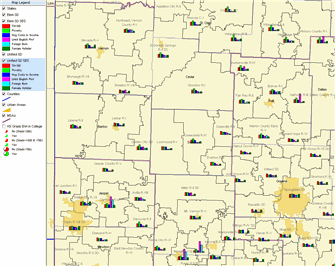
Bootheel Area (click image for larger view; expand browser to full screen; F11 key for IE) 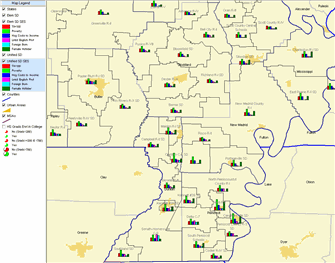
All Districts SES Indexes & Rankings. The maps and graphics provide an easy way to quickly view characteristics for a district and how districts compare. The graphics are based on the SES measures available in a spreadsheet form as shown in the following example. Contact Proximity for more information about the all district SES measures and ranks in spreadsheet form. 
Data Usage and Limitations. For most districts, the "red bar" (state normed value of 100) is of constant height. This makes it easier to compare districts. The red bar will be shorter than that standard height when any of the challenge factor index values exceed 350. Indexes of 350 or greater exist only for a few districts and represent relatively extreme conditions. Analysis of districts having index values of 350 or greater should involve examination of the raw data and computed ratios to gain further insights into reasons for the more extreme values. Views presented in these examples include both elementary and unified school districts. Although the legend shows elementary and secondary districts as separate layers, they are both checked and thus both displayed. [goto top] |
|
|