|
|
-- May 2009 -- April 2009 |
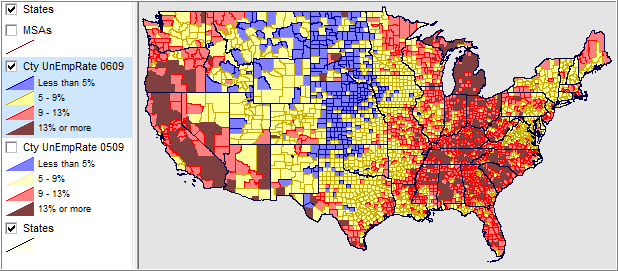
County Monthly Employment and Unemployment Trends -- latest official estimates for June 2009 with projections to December 2009 As of June 2009, more than one-third of all U.S. counties (1,181) had an unemployment rate of 10-percent or more. Fifteen counties had a June 2009 unemployment rate above 20-percent. Nineteen counties, of the 310 counties with June 2009 employment over 100,000, had a June 2009 unemployment rate below 6-percent. Nationally, nonfarm payrolls fell by 467,000 in June 2009, based the U.S. Bureau of Labor Statistics data released July 2, 2009. The June 2009 national unemployment rate increased 0.1 percent to 9.5%. Use tools and resources described in this section, updated monthly, to learn about employment and unemployment trends in your counties of interest. What trends will change when and where? How will this impact you? The MetroDynamics (MD) and Situation & Outlook (S&O) U.S., state, metropolitan area and county quarterly updates include monthly employment and unemployment measures and trend data. Among other labor force data, Proximity integrates county-level employment and unemployment data published monthly by the U.S. Bureau of Labor Statistics (see calendar for "LAUS" release dates) into the MD database. These data are available for MD-based analyses and used to generate the quarterly S&O reports. See notes below for more information on development of these data and concepts. June 2008/2009 County Employment-Unemployment Characteristics Interactive ranking table -- click column header to sort; click again to sort other direction. See related Ranking Tables Main Page; see related similar ranking table for metros Use CountyTrends for more detail/analytical options Continuously Refreshed Projections. Each month Proximity develops an extract file from the MetroDynamics (MD) database focused on county employment and unemployment trends. The extract file includes monthly projections based on the county-level employment and unemployment data published monthly by the U.S. Bureau of Labor Statistics (BLS). Projections are developed by Proximity using the MD Modeler, related data and multi-scenario assumptions. The MD extract data are integrated into a shapefile for visual analysis. The shapefile is added to a CommunityViewer GIS project to develop many different types of employment-unemployment geospatial analyses and maps. Unlike PDF and webserver maps, you can integrate your data with these tools to examine prospective future impact on your projects, programs and operations. Data Access. To obtain the most recent version of the shapefile or Excel file with historical monthly estimates and projections Contact Proximity (mention county employment-unemployment monthly trends) or call (888) 364-7656. See additional information about scope and structure of fields. June 2009 Unemployment Rate by County Updated monthly. See Applications Gallery for additional views. 
Employment and Unemployment Data Development and Concepts Civilian labor force. Included are all persons in the civilian noninstitutional population classified as either employed or unemployed. Employed persons. These are all persons who, during the reference week (the week including the 12th day of the month), (a) did any work as paid employees, worked in their own business or profession or on their own farm, or worked 15 hours or more as unpaid workers in an enterprise operated by a member of their family, or (b) were not working but who had jobs from which they were temporarily absent because of vacation, illness, bad weather, childcare problems, maternity or paternity leave, labor-management dispute job training, or other family or personal reasons, whether or not they were paid for the time off or were seeking other jobs. Each employed person is counted only once, even if he or she holds more than one job. Unemployed persons. Included are all persons who had no employment during the reference week, were available for work, except for temporary illness, and had made specific efforts to find employment some time during the 4 week-period ending with the reference week. Persons who were waiting to be recalled to a job from which they had been laid off need not have been looking for work to be classified as unemployed. Unemployment rate. The ratio of unemployed to the civilian labor force expressed as a percent [i.e., 100 times (unemployed/labor force)]. Data File Content The U.S. by county employment-unemployment shapefile and Excel file are updated monthly. There is one record for each county containing the county name, state and county FIPS codes, BLS/LAUS series code, and monthly fields for the non-seasonally adjusted labor force and employment subject matter items. The monthly labor force and employment fields are provided monthly for the period January 2008 through December 2009 (48 data fields). Additional Information Proximity develops geodemographic-economic data and analytical tools and helps organizations knit together and use diverse data in a decision-making and analytical framework. We develop custom demographic/economic estimates and projections, develop geographic and geocoded address files, and assist with impact and geospatial analyses. Wide-ranging organizations use our tools (software, data, methodologies) to analyze their own data integrated with other data. Contact Proximity (888-364-7656) with questions about data covered in this section or to discuss custom estimates, projections or analyses for your areas of interest. |
|
|