Using GIS & Data Analytics
.. using visual data analytics and developing business intelligence .. Geographic Information Systems (GIS, about GIS) are an important part of this mix and enabling resources. GIS tools have been in use since the 1970's. GIS tools and applications are now required to perform effective data analytics. A main benefit of GIS is that this resource helps us knit together diverse and disparate data that is in a easily consumable form and create non-technical insights not otherwise possible.
It is important that managers, leaders and decision-makers understand the potentials and limitations of GIS -- and how they can be used. This section provides background about GIS evolvement and a "hands-on" tutorial where you will build a thematic pattern map. You will see how the elements come together and how the GIS resources can be used. How to combine geographic and subject matter data from the Federal statistical system with your business establishment and customer data. Learn what the mix tells you that cannot be determined by using these data in a non-map, non-visually integrated form. What missed opportunities might exist? How to efficiently develop marketing programs? Where are areas with high risk?
Are you a student interested in learning more about using GIS resources and how they apply to topics/areas like marketing, business, healthcare, education, economy, social issues? You personally might never be a "map-maker" or GIS user. But to benefit most from use of these resources, you should be exposed to the "how-to."
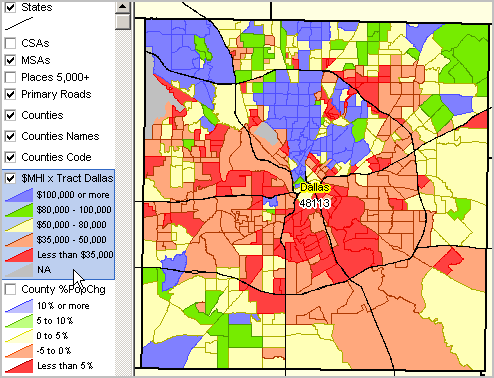
Patterns of Economic Prosperity; Dallas County, TX by Census Tract
The following graphic illustrates a map showing patterns of economic prosperity (median household income) by census tract for Dallas County, TX. Go through a tutorial described below to develop this map view from scratch. Create a similar map for any area using other subject matter.

Evolvement
The origin GIS came with evolving computer technology and geographic-demographic data developments. The availability of the Census Bureau TIGER/Line geographic data coupled with the small area (e.g., census tract) demographic data from the 1980 Census, data analysts had new capabilities to develop insights by seeing demographic patterns in the form of thematic maps. The TIGER/Line data are the geographic backbone for all Census Bureau statistical programs.
As the TIGER/Line geographic data became available in the form of shapefiles, it became much easier for a wider set of users to benefit from GIS applications. These shapefiles advanced in geographic scope and quality in the early 2000's with the Census 2000 shapefiles. Also with Census 2000, a wider array of demographic data became available via the Internet.
With Census 2010, and the Census Bureau TIGER/Line file improvements, there are now a wide array of shapefiles with increased quality and cartographic options. Develop maps for the more than 11 million census blocks. Attach demographics to those geographic data. Add a roads layer based on more than 50 million intersection-to-intersection road. The accuracy of geography such as roads and streams has improved. The TIGER/Line files are now progressively updated annually with more substantial updates as each decennial census approaches.
Software advances, particularly through evolving Visual Component Libraries, have advanced the ability of developers to create new and differentiated GIS applications -- often more geospatial in nature in addition to or replacing maps.
GIS & Data Analytics
Today, there are many, many types of GIS applications that exist. GIS has been increasing interwoven into the broader set of data analytics tools. As the same time, GIS users have grown in type and number. Many GIS tools are now very advanced and have a substantial learning curve. There now exist GIS-related developers who specialize in certain types of tools and certain types of data. Wherever an individual's personal situation is in this GIS spectrum, it is important that managers, leaders and decision-makers understand the potentials and limitations of GIS and how they can leverage these tools and data to better meet their goals and those of their business or organization.
About Geographic Information Systems
A Geographic Information System is a software application that lets you view and analyze multi-sourced data having different geographic dimensions (points/addresses, lines/roads, areas/polygons/census tracts) in different types of maps, charts and tabular relationships. A GIS must be able to combine subject matter data with geographic data, set attributes of those data, and enable the recall and reuse of those data.
Mapping Census Tract Demographics
Use the step-by-step tutorial described at Mapping Census Tract Demographics to see how to develop maps like shown above for any county.
