
Viewer |

|

|

|

|

|
||
Viewer |

|

|

|

|

|

|
|
|
||
Access: main menu bar -- Viewer
Organized data display, viewing and publishing module.
Use integrated with DDA or as standalone application.
Available in all versions.
This section illustrates use of the Viewer tool using census tract level data for South Carolina with subject matter from the 2010 American Community Survey (ACS) 5-year estimates and Census 2010 demographic profiles. Viewer may be used with any type of geography for which these data have been developed (U.S., states, counties, metros, school districts, congressional districts, cities/places, etc.) as well as other data as described below. See U.S/state/county examples.
More About Census Tract Demographics & ACS 2010 5 Year Estimates
http://proximityone.com/acs0610.htm -- National scope Census 2010 Tracts & ACS 2010 Demographics
http://proximityone.com/tracts.htm -- Census 2000 & ACS 2009 Demographics
http://proximityone.com/tracts0010.htm -- Census 2010 Demographics for Census 2000 Geography
Demographic Insights for Custom Defined Study Areas
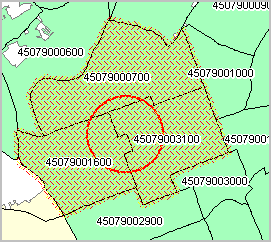
Use CommunityViewer GIS to select geographic areas of interest such as the three census tracts highlighted (cross-hatched) in the graphic below. Automatically save the geographic selections to a file subsequently processed by Viewer to generate the demographic reports. Export demographic reports to RTF for use with Word, Excel files and/or HTML files for Web publishing. See more about using GIS to develop selections file.
Viewer as a DDA Component or Standalone Program
Viewer is available as a standalone program or component of DDA. By design, Viewer has no direct interaction with other DDA operations.
Viewer creates organized profiles suitable for publishing and/or further analysis.
Viewer operates on selected data resources developed by ProximityOne:
•ProximityOne Demographic Estimates and Projections (annual updates) datasets.
•American Community Survey 2010 (annual updates) Demographic Profile datasets.
•Census 2010 Demographic Profile Summary File.
•Census 2010 Summary File 1 Single Year of Age and Age Cohort dataset.
Note that these datasets are not provided with DDA and must be acquired separately.
Operations
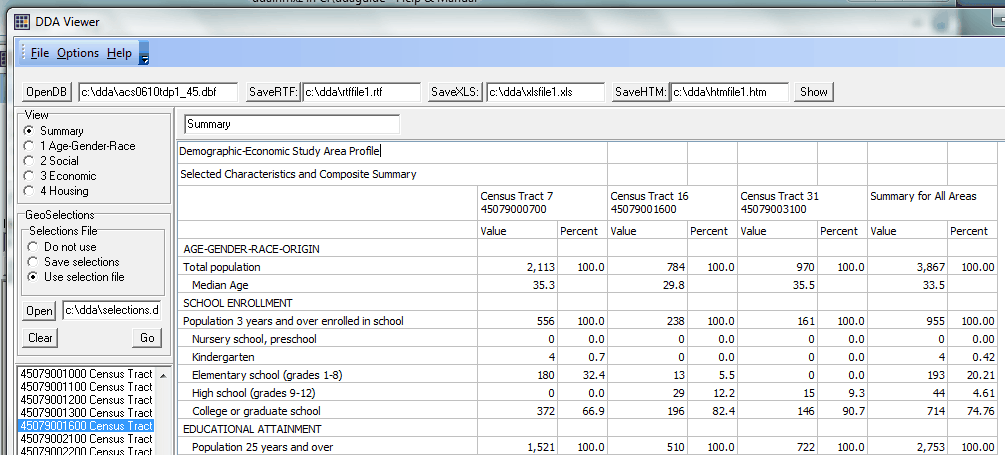
When Viewer is started, the Viewer window displays as shown below.
In this example, there are three steps to generate the display as shown.
1 -- OpenDB -- Specify file path/name and then click OpenDB button.
-- example uses South Carolina Census 2010 census tracts geography with ACS 2010 5 year estimates demographic profiles.
-- when this button is clicked the lower left listbox is populated with the GEOID field from the active DB.
2 -- GeoSelection -- Click a radiobutton to indicate how geography will be selected.
-- example uses "Use selection file"
-- geoselections file is "c:\dda\selections"
-- field named "GEOID" is always required/used.
3 -- the Go button is clicked resulting in the grid display as shown.
Viewing Subject Matter in Data Grids
When using the American Community Survey (ACS) (or Demographic Estimates and Projections), 5 data grids are populated when the Go button is clicked. Navigate between the grids by clicking on radiobuttons shown in the upper left View group box. Grids are:
•Summary (custom designed selection of items from DP1 through DP4 or other datasets)
•1 Age-Gender-Race/Origin (Demographic Profile 1)
•2 Social Characteristics (Demographic Profile 2)
•3 Economic Characteristics (Demographic Profile 3)
•4 Housing Characteristics (Demographic Profile 4)
•C Census 2010
Data Grids present data with subject matter stubs in column 1. Data for each geographic area selected are shown in two column sets. The demographic data value is shown in column 1 of each two column set and related percentages are shown in column 2 of the two column set. The geographic name/geocodes are shown at the top of the column .
Viewer is designed to develop summary profiles for aggregates of a set of geographic areas; for example a set of three census tracts. It may be of analytical interest to view the demographics for the composite area (study area, impact region, market area) covered by the set of selected areas rather than individual areas. The two summary columns for the composite/grouped area are shown as the rightmost columns in the grid.
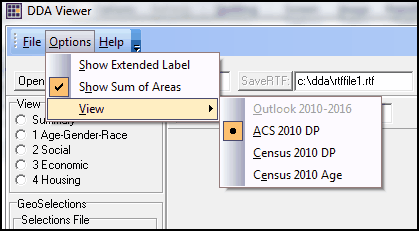
The Show-Sum-of-Areas feature is set to On by default as shown below. Uncheck this checkbox if the summary columns are not desired. If the Sum option is checked, the summary columns are shown in each of the five grids.
Selecting Geography
Geography for areas to be displayed may be selected manually and/or using a geographic selections file and then clicking the Go button to start processing. Select geography manually by multi-selecting geocodes in the listbox.
When using a geographic selections file, the geographic selections file must be a dbase file, must contain the geography selection key field named GEOID and the GEOID values in the selection file must match the GEOID field in the OPENDB dataset. The selection file is structured in this manner to take advantage of using the Census Bureau TIGER files.
Creating a GeoSelections File with CommunityViewer GIS
Columbia, SC green fill pattern; census tract boundaries black

Use CV Site Selection Tool to Save Selections to File. Note output file named at bottom of site selection panel.
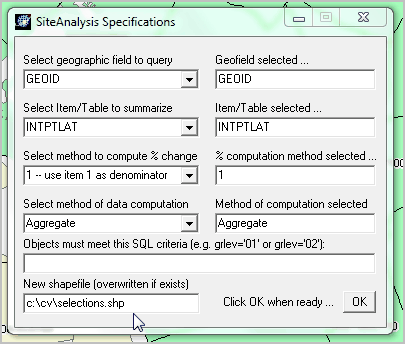
Cherry pick or use circle/radius to select areas to be included in selection file. In this application, three tracts are selected.

Structure and Interpretation of Grid Content
Sample HTML views created for three tract study area:
(using ACS 2010 5 year estimates data and Census 2010 demographics)
Summary/custom profile -- http://proximityone.com/dda/htmfiles.htm
--the summary/custom profile includes selected ACS 2010 and Census 2010 demographics
ACS General Demographics - DP1 - http://proximityone.com/dda/htmfile1.htm
ACS Social Characteristics - DP2 - http://proximityone.com/dda/htmfile2.htm
ACS Economic Characteristics - DP3 - http://proximityone.com/dda/htmfile3.htm
ACS Housing Characteristics - DP4 - http://proximityone.com/dda/htmfile4.htm
Census 2010 Demographic Profile - http://proximityone.com/dda/htmfilec.htm
Creating Content Specifications for Custom Grid
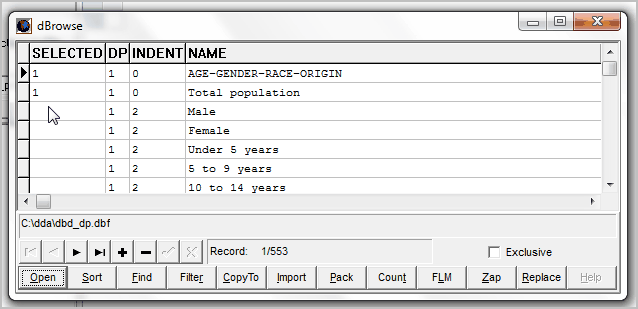
Select content for the custom grid by using the dBrowser with the corresponding database dictionary (DBD).
The DBD for the ACS and demographic estimates and projections is named dbd_dp.dbf and is located in the DDA installation folder.
The following view shows the file c:\dda\dbd_dp.dbf opened using dBrowser.
Records with a 1 in the SELECTED field will be displayed in the custom grid; other fields/DBD records are not shown.
Important. Do not modify any other fields or record/file structure in the DBD or Viewer may not operate correctly.
Exporting Results to Word, Excel and/or HTML
Optionally export data shown in the active grids using the buttons and edit boxes located below the main menu bar.
![]()
SaveRTF
Saves grid(s) content file named in edit box to right of SaveRTF button in Rich Text Format.
Use these files with Word for use in Word documents/reports.
Using c:\dda\rtffile1.rtf in this example will result in overwriting this file.
Key in an alternate file name to permanently save the files to a different name.
The file name must end with characters "1.rtf" (not case sensitive).
For the ACS and Outlook datasets, five files are created *s.rtf *1.rtf *2.rtf *3.rtf *4.rtf *c.htm
SaveXLS
Saves grid(s) content file named in edit box to right of SaveXLS button in XLS structure.
Open these files with Excel or compatible software.
Excel must be installed on the computer to use this feature (does not need to be running).
Using c:\dda\xlsfile1.xls in this example will result in overwriting this file.
-- key in an alternate file name to permanently save the files to a different name.
The file name must end with characters ".xls" (not case sensitive).
For the ACS and Outlook datasets, a single xls file is created with five worksheets.
SaveHTM (and related Show button)
Saves grid(s) content file named in edit box to right of SaveHTM button in HTML Format.
Use these files as complete standalone Web pages or merge selected edited portions with other HTML code.
Using c:\dda\htmfile1.htm in this example will result in overwriting the file(s).
Key in an alternate file name to permanently save the files to a different name.
The file name must end with characters "1.htm".
For the ACS and Outlook datasets, five files are created *s.htm *1.htm *2.htm *3.htm *4.htm *c.htm