San Diego County, CA
Selected CV XE GIS project/application views in California.
Click toggle in Table of Contents at left to view sub-state applications.
Integrating shapefiles, ACS demographics, Census 2010 demographics, estimates & projections and related data.
See related interactive ranking tables:
| • | California school district demographics: http://proximityone.com/ca_sdc.htm |
| • | California census tract demographics: http://proximityone.com/tracts11dp1.htm |
| • | Census 2010 demographics: http://proximityone.com/s&o_comparative_profiles.htm |
(all US geography: state, congressional district, county, school district, city/place, metro)
Join the conversation .. ProximityOne on Twitter -- https://twitter.com/ProximityOne
View demographic-economic trends profile for San Diego County, CA; access other county demographic profiles via ranking table links.
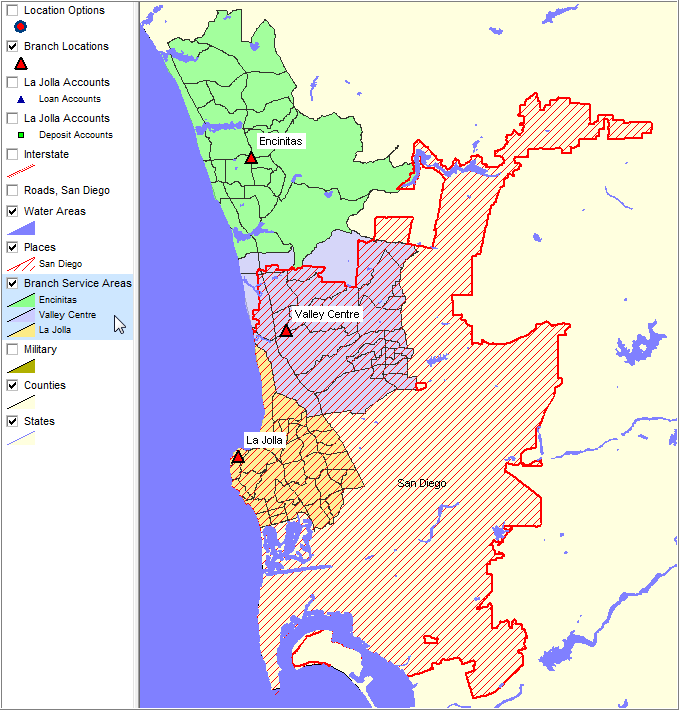
Branch office locations shown as red triangular markers. Branch service areas are sets of contiguous census tracts (color coded - see layer colors in legend at left) San Diego city shown as red diagonal hatched area.
|
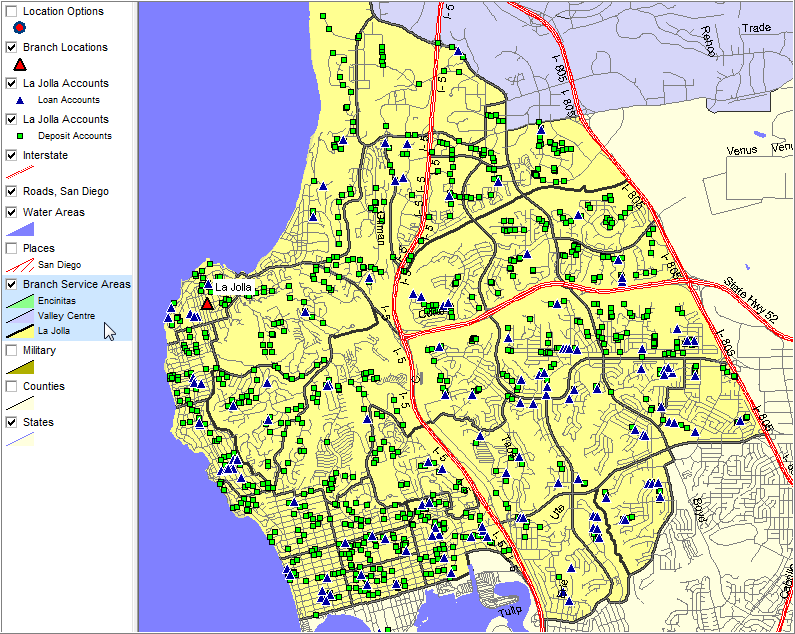
Customers geocoded using CommunityViewer. This view shows geocoded customers as green box (deposit) and blue triangle (loan) markers in context of streets and tracts (bolded boundaries).
|
Tract boundaries bolded to easily view location; tract label added. Identify tool used to show mini-profile of selected customer. Easily identify clustering of accounts; examine by age, see which areas are growing visually.
|
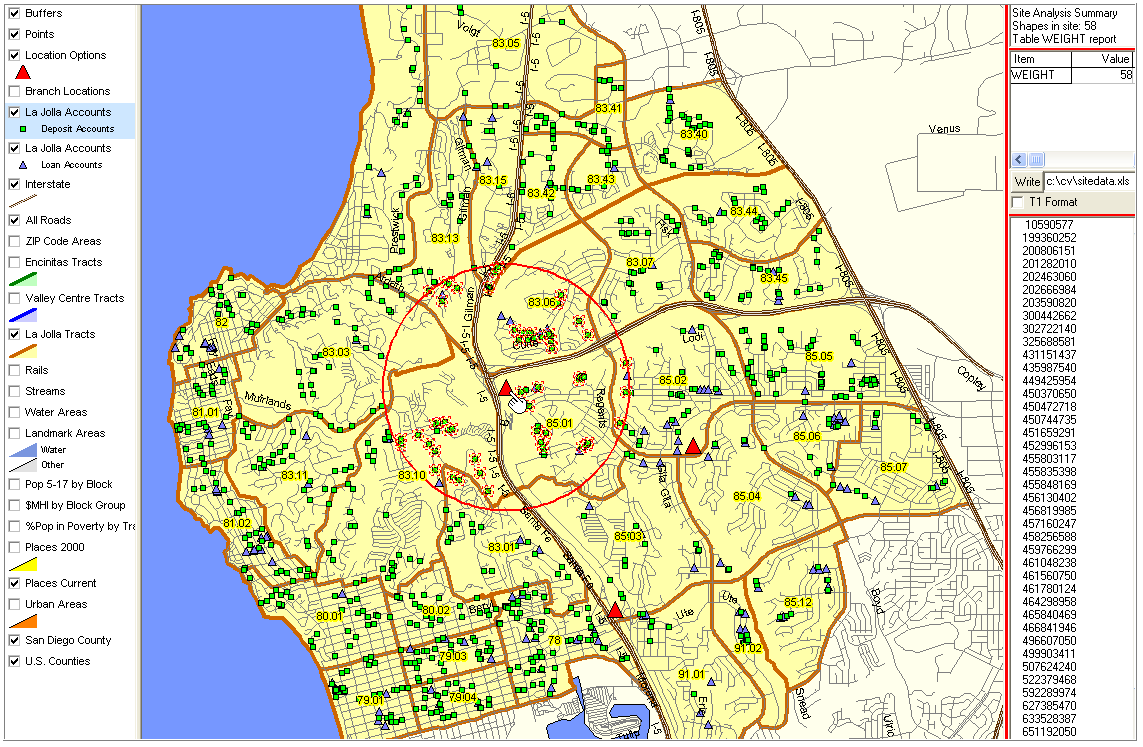
This view illustrates use of the CommunityViewer site analysis tool to count, display locations and display client account numbers for selected types of accounts in a study area.
|


