Joplin, MO

Contents
Selected CommunityViewer project/application views in Missouri.
Click toggle in Table of Contents at left to view sub-state applications.
Integrating Census 2010 TIGER Shapefiles, ACS 2009 5-year demographics, Census 2010 demographics and related data..
See related interactive ranking tables:
| • | Missouri school district demographics: http://proximityone.com/sd_mo.htm. |
| • | Missouri census tract demographics: http://proximityone.com/ustr0509_mo.htm. |
| • | Census 2010 demographics: http://proximityone.com/cen2010_pl94171.htm |
(all US geography: state, congressional district, county, school district, city/place, metro)
The GIS project fileset used to develop the views shown below is available for your use. Add your own data; create alternative views. We can also provide custom map views or analyses to meet your needs. Contact us for details (888-364-7656).
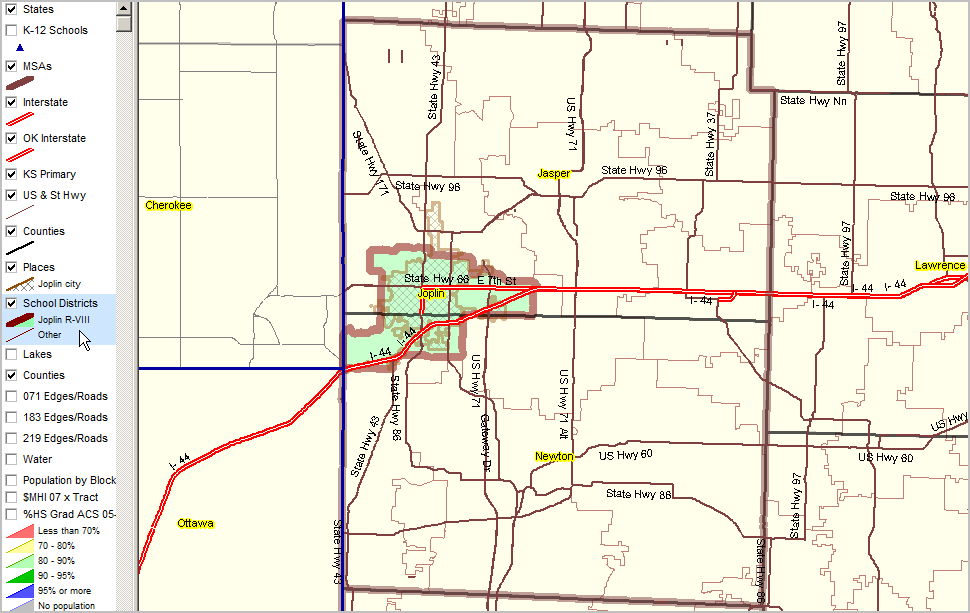
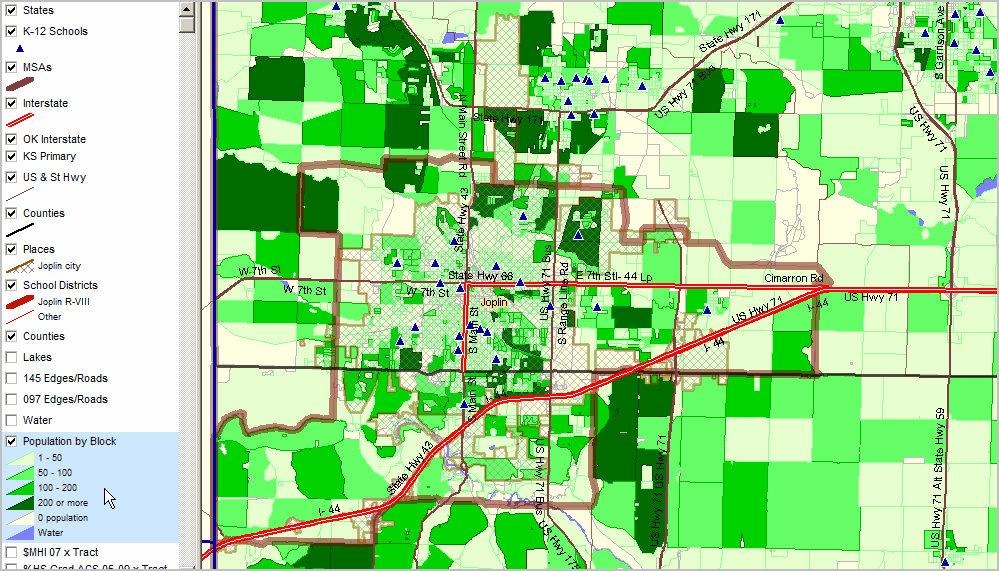
Joplin R-VIII School District bold brown boundary green fill pattern in context of Joplin MSA (bold brown semi-transparent boundary). Joplin city diagonal cross-hatch pattern.
|
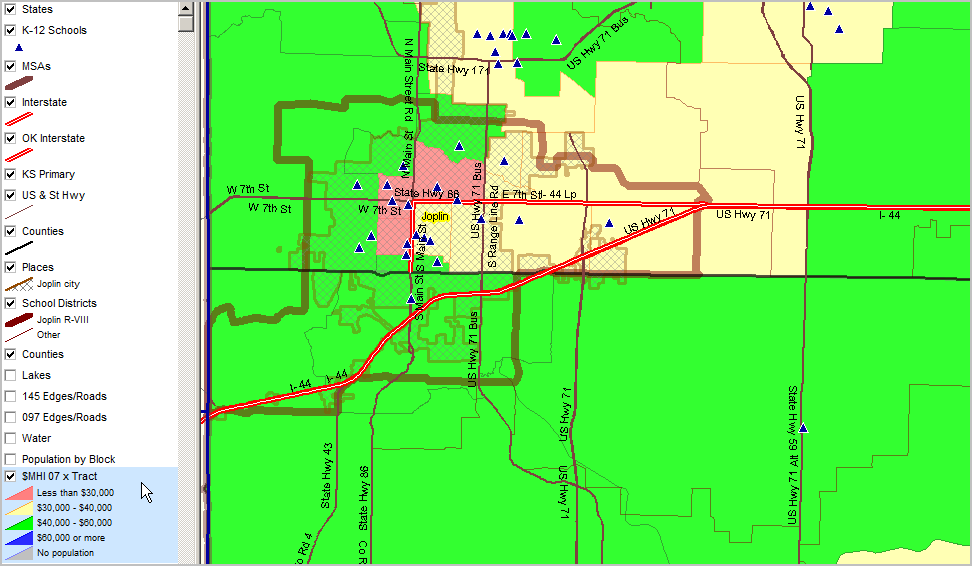
Median Household Income ACS 2005-09 (mid-2007) ... using ACS census tract estimates released December 2010 (http://proximityone.com/acs.htm). See highlighted (blue) layer in legend (left of map) for color/data value interval definitions. K-12 Schools blue markers.
|
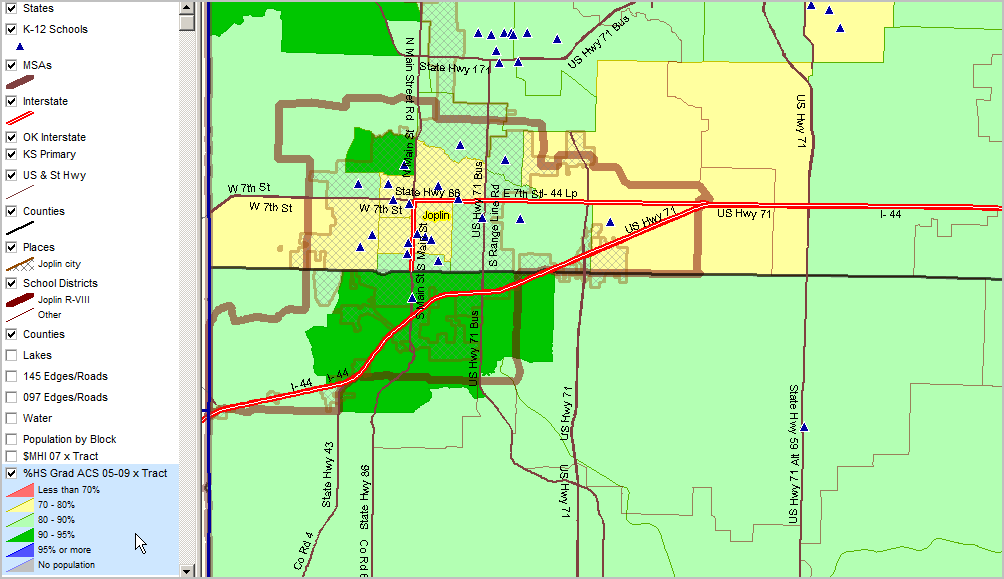
Percent high school graduate (population 25 years and over) by school district. Data based on 2009 American Community Survey (http://proximityone.com/acs.htm) 5-year estimates, centric to mid-2007. See highlighted (blue) layer in legend (left of map) for color/data value interval definitions. K-12 Schools blue markers.
|
See highlighted (blue) layer in legend (left of map) for color/data value interval definitions. More about these data: http://proximityone.com/cen2010_blocks.htm.
|
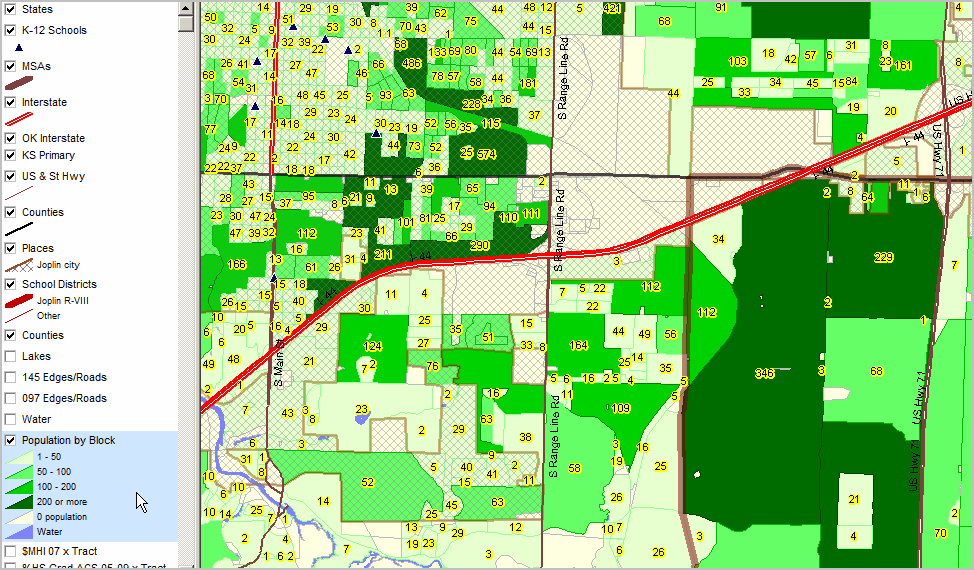
View similar to above showing total population by block as label. Intersection-to-intersection street detail and K-12 schools shown.
|
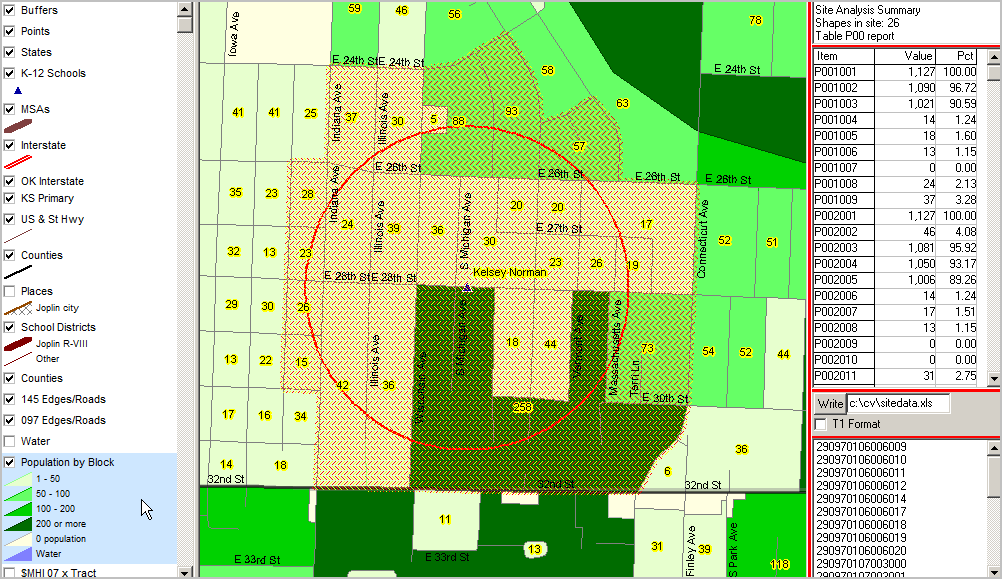
Further zoom-in ... CV Site Analysis operation applied to census block layer; blocks touching 0.5 mile circle centered on school. In the graphic below, table in upper right shows 26 blocks (cross-hatched) in this study area.
Aggregate demographics for selected blocks are shown in the mini table below that count: 1,127 total population in this set of blocks (p001001); 1,021 "White population of one race" (p001003) in this set of blocks. 46 Hispanic (p002002) and 1,081 non-Hispanic (p002003) Item names shown in left column of profile defined at http://proximityone.com/cen2010_blocks.htm.
List of geocodes for blocks included shown in lower right mini table. By clicking "Write" button, the summary data are written to specified spreadsheet file.
|