|
|
School Districts Main Page More Detailed Demographics Map of ACS0507 Districts Assessing RCNE Impact About ACS0507 |
School Age Children Not Enrolled in School -- demographic updates and ranking table "School age children not enrolled in school" is the population group that contains dropouts as well as persons who have not entered a school to become a dropout. In many school districts, the size of this group is as much as 8-to-10 times the size of the reported number of dropouts. Since this population is largely not in school to even become dropouts, this population is not measured by any in-school data collection program. Essentially, they go unseen. The population group school age grade relevant children is defined as the population residing in the district, ages 5-19 years, not high school graduate, either enrolled (private and public school) or not enrolled, and in a grade offered by the school district. The population group school age children not enrolled in school is also referred to as "relevant children not enrolled" (RCNE). The term "relevant" means that the population is grade relevant to the grades offered by the specific school district. Proximity works with schools and school districts to develop current estimates of the RCNE population, assess impact, and develop strategies to mitigate and reduce the RCNE population. More. This Web page provides demographic updates on the RCNE population based on data tabulated from the American Community Survey (ACS) 2005-07 school district special tabulation. Data were tabulated from the ACS 2005-07 program for school districts with 20,000 population or more (approximately, 3,300 school districts). These districts include an estimated 43,923,608 school age grade relevant children (36,855,429 enrolled in public schools, 4,960,520 enrolled in private schools, and 2,111,038 (4.8-percent) not enrolled in school). School Age Grade Relevant Children Not Enrolled in School -- 2005-07 Demographics Interactive ranking table -- click column header to sort; click again to sort other direction. See related Ranking Tables Main Page; School District Demographics; Children's Demographics; Cenus 2010/ACS; Houston Focus -- see usage notes below Usage Notes Data for a few school districts are missing. These data cells are shown with a -1 value. Column headers are defined below. TotPop -- total population Pop5-19 -- total population ages 5-19 GRPop519 -- Grade Relevant Population ages 5-19 and not high school graduate (sum of EnrlPub+EnrlPrv+RCNE) EnrlPub -- grade relevant population ages 5-19 and not high school graduate -- enrolled -- public EnrlPrv -- grade relevant population ages 5-19 and not high school graduate -- enrolled -- private RCNE -- grade relevant population (ages 5-19 and not high school graduate) not enrolled in school Pct RCNE -- RCNE as percent of GRPop519 Grade Relevancy A child is relevant to a school district if he/she lives within the territory of the district and his/her assigned grade falls within the grade range provided by a district. One of the unique features of school district geography is the potential for district boundaries to share the same physical territory but serve children of different grade levels. This overlap typically occurs in areas organized by elementary and secondary school districts. More Detailed Subject Matter & Universes The ACS0507 school district special tabulation includes hundreds of subject matter items for each school district. These subject matter items are tabulated for each of the total population universe, total children universe and five additional universes for grade relevant children. The following table provides an example of Table B01001 selected items for each of several tabulation universes for the Brownsville ISD, TX school district.
Tot Rel ... total grade relevant (total enrolled and not enrolled) Estimates are rounded to nearest 5 The "5-19 years" row (4th table row) in the above table shows the same values as in the ranking table. By examining additional detail (beyond that shown in ranking table), it is possible to see how RCNE is distributed by gender and age. Geographic Distribution of ACS0507 School Districts 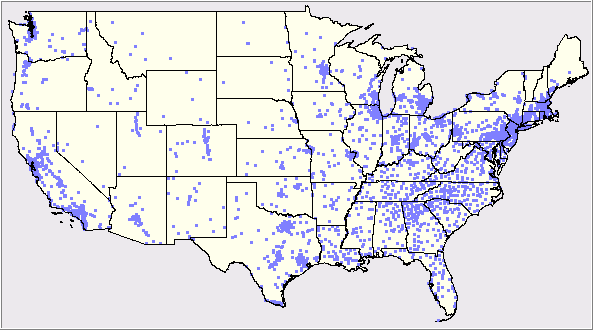
Additional Information Proximity develops geodemographic-economic data and analytical tools and helps organizations knit together and use diverse data in a decision-making and analytical framework. We develop custom demographic/economic estimates and projections, develop geographic and geocoded address files, and assist with impact and geospatial analyses. Wide-ranging organizations use our tools (software, data, methodologies) to analyze their own data integrated with other data. Specialists in school and school district geodemographics, we help school system learn more about their community and help identify ways to improve performance and educational opportunities. Contact Proximity (888-364-7656) with questions about data covered in this section or to discuss custom estimates, projections or analyses for your areas of interest. |
|
|