|
|
CommunityViewer Main Page CV Site Analysis Demographic-Economic Estimates & Projections TIGER/Line & GeoBase |
Address Analysis Using CommunityViewer
Consider the situation where you have street address and zip code for set of clients or other entities. The set of addresses might be for a city, a state, or drawn from all over the U.S. You desire to learn about neighborhood demographics associated with each address. What are the demographic attributes of each address? You might like to know persons per household, racial diversity, economic prosperity, educational attainment, median age, family size, housing value, age of housing units, units in structure, renter versus owner occupancy, and other such attributes. You can use the CommunityViewer integrated software and databases to perform these tasks. Learn about characteristics of your addresses not possible to determine any other way. Find out how you might change your marketing, service, support or other operations to improve performance of your organization. This section reviews CommunityViewer operations used to: • geocode your address data on your computer. • add the latitude-longitude coordinates, state FIPS, county FIPS, census tract, and block group code fields to each address record. • add demographic data field for the block group area where that address is located to each address record. • choose which demographic items from a selection of more than 600 items. • convert the geographic and demographic integrated data into a point shapefile. • analyze the integrated data using CV tools such as site analysis. Neighborhood Demographics: Update. The first small area demographic updates since Census 2000 become available from the American Community Survey in December 2010. These new annual updates provide thousands of subject matter items down to the census block group (BG) (210,000 areas) and census tract (65,000 areas) levels. Both geographies covering U.S. wall-to-wall. See more about the block group demographics. Those data are centric to mid-2007 ... current estimates are needed. New 2010-2015 demographic-economic estimates and projections integrated/coordinated with Census 2010 and American Community Survey data become available from ProximityOne in early 2011. The annually updated 5-year estimates and projections are for geographic areas down to the block group and ZIP Code area levels. See details. Address Analysis using CommunityViewer -- Example Start-up CV project. A CommunityViewer project exists that is used as a basis developing the address-coded data. The same project could also be used for analyzing the new data in context with other existing data and map files. In this example, a project focused on San Diego is used. To complete all steps in the application reviewed here, the project must include a census block groups (BG) shapefile with the GIS project layer name "Block Groups". 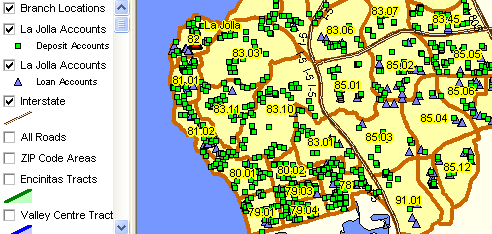
Separate from the project files, an original client excel file exists as shown below. These address data might have been extracted from a master file, keyed in or developed in some other manner. The key requirements are that a street address field exist and a 5-digit ZIP code field exist. Other fields are optional. 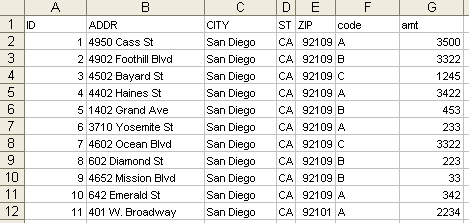
Latitude-Longitude Assigned. The CV Tools>Geocoder is used to assign latitude-longitude coordinates to the client original xls file. 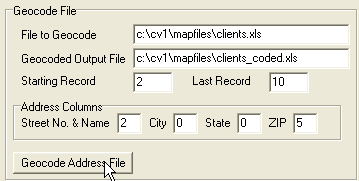
New Client_Coded XLS File. The clients_coded.xls output file now contains the latitude-longitude for each address. 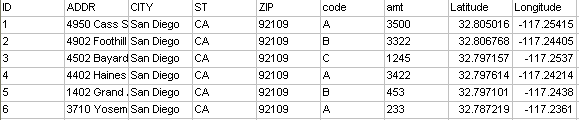
Create Point Shapefile. The CV Tools>CreateShapefile is now used to convert the clients_coded xls file to the clients.shp shapefile. This step is required to use the data in the GIS project and to specify what subject matter fields are to be appended to each address record. 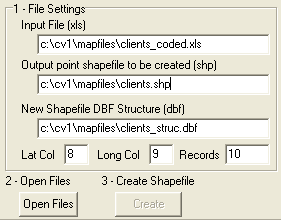
Creating New Shapefile Structure. Using CV Database>dBCreate the clients_struc.dbf structural format file is set up. The fields added by the user (in this reusable file) include these geocode fields: state FIPS, county FIPS, census tract, and census block group. In this example, the user chooses to add two subject matter fields from the block group demographics database (dp1.dbf through db4.dbf must be installed on the user computer for the states to be processed). 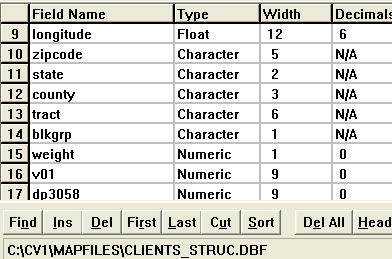
V01 is the DP1001 item (total population) contained in the Demographic Profile 1 (DP1) http://proximityone.com/dp1.htm. DP3058 is the DP3058 item (median household income) contained in the Demographic Profile 3 (DP3) http://proximityone.com/dp3.htm. Add Clients Shapefile to Project. The new shapefile can now be added to the project. Red markers are the locations of the clients. 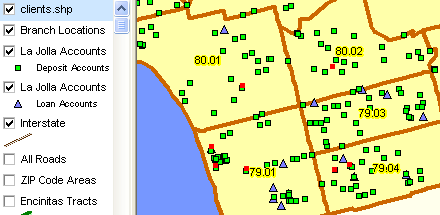
Insert Geocodes and Join Demographics. The CV Tools>Geocode & Join Data is used to simultaneously a) add geocodes (state, county, tract, block group) and b) link BG demographics into address record (V01 and DP3058). The resulting file clients.dbf may be opened directly in Excel. Interpreting the first record, it can be observed that the address with ID 1 is located in state 06, county 073, census tract 008001 (80.01) and block group 2. Demographic attributes of this block group include population of 969 with median household income of $42,734. 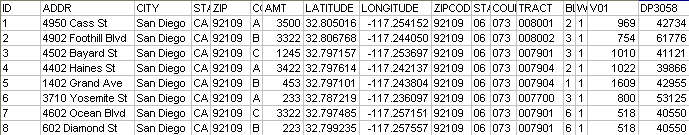
Viewing the Data. This completes development of the clients.shp shapefile. The data may be viewed using the identify tool. The block group layer has been clicked-on and appears with black boundary in the next graphic. The profile displayed is for the marker by the pointer. 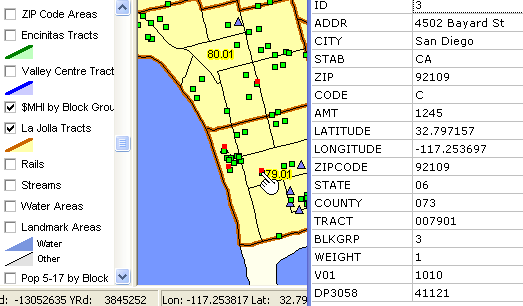
Site Analysis. The CV Tools>Site Analysis tool can be used to perform site analysis operations. This simple example illustrates how this tool can be used to count the number of markers. 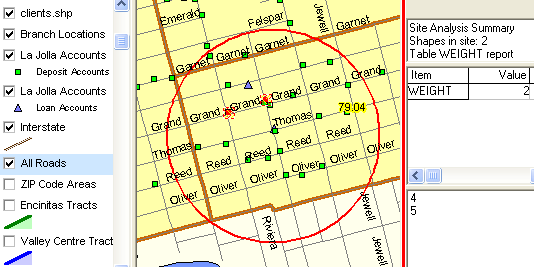
Up to 200 Demographic Profile (DP) items can be specified by the user to be added to each address record. Site Analysis can be used to display a summary profile of the aggregated data (across all selected address markers) for whatever set of DP items is selected. Block Group Demographic Profiles. Use the CV Analytics>Comparative Demographic Profile>Block Groups to view the full DP1 through DP4 data for any block group. The following view shows data for three block groups in adjacent column set. The geocodes identifying the block groups are shown at the top (state-county-tract-block group). 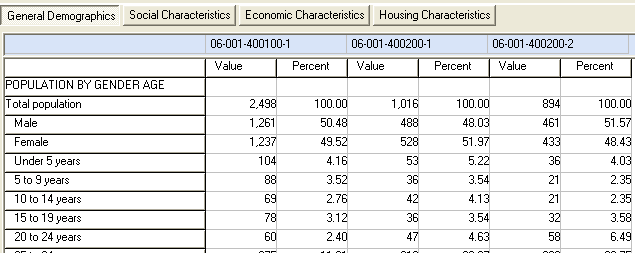
Profile data written to the display screen are also written to an Excel file. Note that there are 4 worksheets. 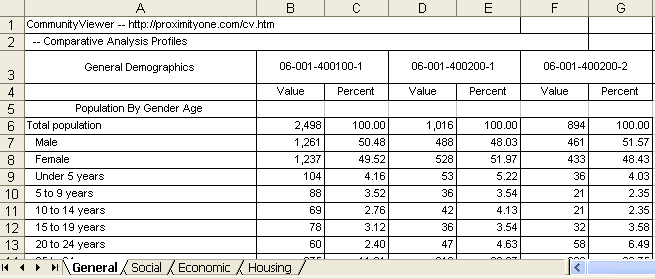
Additional Information Proximity develops geodemographic-economic data and analytical tools and helps organizations knit together and use diverse data in a decision-making and analytical framework. We develop custom demographic/economic estimates and projections, develop geographic and geocoded address files, and assist with impact and geospatial analyses. Wide-ranging organizations use our tools (software, data, methodologies) to analyze their own data integrated with other data. Contact Proximity (888-364-7656) with questions about data covered in this section or to discuss custom estimates, projections or analyses for your areas of interest. |
|
|