|
|
Colorado Decision Making Information Resources
... updated periodically with topics relating to Colorado data access and use.
Resources summarized here relate to Proximity specialization areas. This Web page
is not intended to be a comprehensive listing
of all decision-making information resources.
Proximity makes these resources available to clients and assist clients with integration of
these and related data to support decision-making needs.
• Metros
- Denver-Aurora MSA component area map
- Denver-Aurora MSA quarterly establishments & employment trends update
- Denver-Aurora MSA quarterly housing price index
• Congressional Districts
• Counties
• Places
• Small Area
• Schools & School Districts
• Maps & GIS
• AmericasTrends
Colorado Metropolitan Areas
... use above link to access data and maps for current definition metropolitan areas.
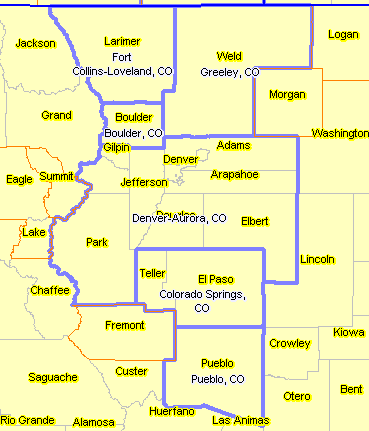
Denver-Aurora, CO MSA and area metros (blue boundaries)

See Denver-Aurora, CO MSA Component area county/population listing below.
Denver-Aurora, CO MSA Establishments & Employment Trends
See establishments & employment trends update for additional information
Denver-Aurora, CO MSA (19740)
The Denver-Aurora, CO MSA ranked number 243 among all MSAs (369 MSAs) based on percent change in total wages between 2nd quarter 2003 and 2nd quarter 2004.
Total wages changed by 3.44 percent from $11,887,754 (2003q2) to $12,296,182 (2004q2). 1
The total number of establishments changed by 1.67 percent (national MSA rank 167) from 79,069 (2003q2) to 80,391 (2004q2).
Total employment for June changed by 0.99 percent (national MSA rank 223) from 1,156,390 (June 2003) to 1,167,820 (June 2004).
Average weekly wages changed by 2.63 percent (national MSA rank 209) from $797 (2003q2) to $818 (2004q2).
|
| Economic Characteristics of Denver-Aurora, CO MSA |
| Economic Measure |
2003Q2 |
2004Q2 |
Change |
Percent
Change |
MSA Rank
(% Change) |
| Total Wages 1 |
$11,887,754 |
$12,296,182 |
$408,428 |
3.44 |
243 |
| Average Weekly Wages |
$797 |
$818 |
$21 |
2.63 |
209 |
| Establishments |
79,069 |
80,391 |
1,322 |
1.67 |
167 |
| Employment (June) |
1,156,390 |
1,167,820 |
11,430 |
0.99 |
223 |
| 1 Total Wages in thousands of dollars. |
| Source: Proximity -- http://proximityone.com -- based on U.S. Department of Labor BLS CEW data. |
Metropolitan Area Housing Price Index
... integrate the latest county demographics into shapefiles for mapping.
Latest Official Colorado County Population Estimates and Trends
... integrate the latest county demographics into shapefiles for mapping.
County Demographic Trends Example for the Denver-Aurora, CO MSA
Component Counties and Summary Demographic Trends
| Component Counties of Denver-Aurora, CO MSA |
| Component Area Code and Name |
Population
4/1/2000 |
Population
7/1/2001 |
Population
7/1/2002 |
Population
7/1/2003 |
PctChange
2000-03 |
Pct of Area
2003 |
| 08001 Adams County |
351,094 |
360,659 |
372,609 |
380,273 |
8.31 |
16.83 |
| 08005 Arapahoe County |
491,523 |
503,116 |
510,163 |
516,060 |
4.99 |
22.85 |
| 08019 Clear Creek County |
9,316 |
9,414 |
9,547 |
9,538 |
2.38 |
0.42 |
| 08031 Denver County |
555,410 |
561,559 |
558,379 |
557,478 |
0.37 |
24.68 |
| 08035 Douglas County |
180,404 |
198,061 |
211,577 |
223,471 |
23.87 |
9.89 |
| 08039 Elbert County |
20,123 |
21,253 |
22,034 |
22,254 |
10.59 |
0.99 |
| 08047 Gilpin County |
4,798 |
4,807 |
4,841 |
4,845 |
0.98 |
0.21 |
| 08059 Jefferson County |
526,477 |
529,950 |
530,496 |
528,563 |
0.40 |
23.40 |
| 08093 Park County |
14,691 |
15,401 |
16,087 |
16,465 |
12.08 |
0.73 |
| Area Totals |
2,153,836 |
2,204,220 |
2,235,733 |
2,258,947 |
4.88 |
100.00 |
| Source: Proximity -- http://proximityone.com -- based on Census Bureau post-Census 2000 estimates. |
Colorado County Detailed Age-Gender-Race/Ethnicity Demographic Updates
... use above link to access latest county demographic data.
County A-R-S-O Demographic Trends Example for the Denver County, CO (Hispanic population)
| Demographic Trend Analysis: Denver County, CO (08031) | | Gender: Total; Age: All 5-Year; Race: Total; Origin: Hispanic/Latino | | | 2000 | 2001 | 2002 | 2003 | | Age Group | Population | Percent | Population | Percent | Population | Percent | Population | Percent | | 0 to 4 yrs | 19,308 | 10.99 | 19,274 | 10.98 | 19,439 | 10.94 | 21,649 | 12.19 | | 5 to 9 yrs | 17,398 | 9.90 | 17,373 | 9.90 | 17,473 | 9.83 | 18,039 | 10.15 | | 10 to 14 yrs | 14,657 | 8.34 | 14,642 | 8.34 | 14,819 | 8.34 | 15,434 | 8.69 | | 15 to 19 yrs | 15,134 | 8.61 | 15,124 | 8.61 | 15,112 | 8.51 | 14,538 | 8.18 | | 20 to 24 yrs | 18,756 | 10.67 | 18,745 | 10.68 | 18,948 | 10.67 | 19,402 | 10.92 | | 25 to 29 yrs | 19,168 | 10.91 | 19,145 | 10.90 | 19,411 | 10.93 | 20,221 | 11.38 | | 30 to 34 yrs | 15,766 | 8.97 | 15,758 | 8.98 | 16,082 | 9.05 | 17,004 | 9.57 | | 35 to 39 yrs | 13,273 | 7.55 | 13,269 | 7.56 | 13,403 | 7.54 | 13,993 | 7.88 | | 40 to 44 yrs | 10,529 | 5.99 | 10,528 | 6.00 | 10,684 | 6.01 | 11,143 | 6.27 | | 45 to 49 yrs | 8,342 | 4.75 | 8,336 | 4.75 | 8,470 | 4.77 | 8,792 | 4.95 | | 50 to 54 yrs | 6,791 | 3.87 | 6,790 | 3.87 | 6,953 | 3.91 | 7,272 | 4.09 | | 55 to 59 yrs | 4,695 | 2.67 | 4,695 | 2.67 | 4,797 | 2.70 | 5,083 | 2.86 | | 60 to 64 yrs | 3,626 | 2.06 | 3,625 | 2.06 | 3,687 | 2.08 | 3,746 | 2.11 | | 65 to 69 yrs | 2,825 | 1.61 | 2,825 | 1.61 | 2,849 | 1.60 | 2,877 | 1.62 | | 70 to 74 yrs | 2,271 | 1.29 | 2,271 | 1.29 | 2,304 | 1.30 | 2,264 | 1.27 | | 75 to 79 yrs | 1,586 | 0.90 | 1,585 | 0.90 | 1,609 | 0.91 | 1,673 | 0.94 | | 80 to 84 yrs | 897 | 0.51 | 897 | 0.51 | 923 | 0.52 | 991 | 0.56 | | 85+ yrs | 682 | 0.39 | 682 | 0.39 | 701 | 0.39 | 742 | 0.42 | | Total | 175,704 | 100.00 | 175,564 | 100.00 | 177,664 | 100.00 | 184,863 | 100.00 | | Source: Proximity -- http://proximityone.com -- based on Census Bureau post Census 2000 estimates |
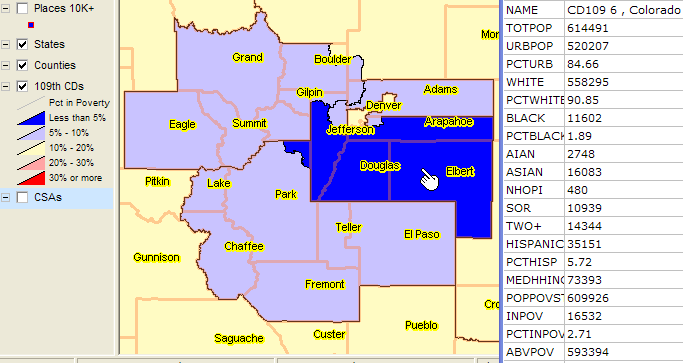
Colorado 109th Congress Congressional Districts
... Colorado District 6 ranks 7th based on median household income
click to view spreadsheet (xls)
Colorado 109th CD 6 profile:

Colorado City/Place Demographic Updates
... access latest city/place demographic data.
City/Place Demographic Trends Example for the Denver-Aurora, CO MSA (larger cities)
Larger Cities and Summary Demographic Trends
| Larger Cities in Denver-Aurora, CO MSA |
| Places/Cities with 2003 Population>5,000 |
Population
4/1/2000 |
Population
7/1/2001 |
Population
7/1/2002 |
Population
7/1/2003 |
PctChange
2000-03 |
Pct of Area
2003 |
| Arvada, CO |
102,271 |
102,172 |
101,916 |
101,972 |
-0.29 |
4.75 |
| Aurora, CO |
277,555 |
284,239 |
285,909 |
290,418 |
4.63 |
12.89 |
| Brighton, CO |
21,201 |
22,203 |
23,425 |
25,459 |
20.08 |
0.98 |
| Castle Rock, CO |
20,843 |
23,195 |
25,890 |
29,869 |
43.30 |
0.97 |
| Cherry Hills Village, CO |
5,980 |
6,083 |
6,079 |
6,090 |
1.84 |
0.28 |
| Commerce City, CO |
21,390 |
22,039 |
23,999 |
26,228 |
22.62 |
0.99 |
| Denver, CO |
555,410 |
561,559 |
558,379 |
557,478 |
0.37 |
25.79 |
| Edgewater, CO |
5,458 |
5,499 |
5,436 |
5,356 |
-1.87 |
0.25 |
| Englewood, CO |
31,870 |
32,510 |
32,970 |
32,762 |
2.80 |
1.48 |
| Federal Heights, CO |
12,085 |
12,075 |
12,062 |
11,850 |
-1.94 |
0.56 |
| Golden, CO |
17,200 |
17,280 |
17,328 |
17,550 |
2.03 |
0.80 |
| Greenwood Village, CO |
11,276 |
12,257 |
12,705 |
12,731 |
12.90 |
0.52 |
| Lakewood, CO |
144,137 |
143,849 |
143,427 |
142,474 |
-1.15 |
6.69 |
| Littleton, CO |
40,319 |
40,335 |
40,385 |
40,599 |
0.69 |
1.87 |
| Lone Tree, CO |
6,920 |
6,959 |
7,496 |
7,600 |
9.83 |
0.32 |
| Northglenn, CO |
31,819 |
32,526 |
33,520 |
32,943 |
3.53 |
1.48 |
| Parker, CO |
24,699 |
29,083 |
32,423 |
34,527 |
39.79 |
1.15 |
| Sheridan, CO |
5,602 |
5,627 |
5,574 |
5,577 |
-0.45 |
0.26 |
| Thornton, CO |
83,814 |
88,114 |
93,216 |
96,584 |
15.24 |
3.89 |
| Westminster, CO |
101,373 |
102,316 |
103,335 |
103,391 |
1.99 |
4.71 |
| Wheat Ridge, CO |
32,858 |
32,574 |
32,205 |
31,782 |
-3.27 |
1.53 |
| Source: Proximity -- http://proximityone.com -- based on Census Bureau post-Census 2000 estimates. |
Small Area Demographics
Colorado Census Tract Demographics
... Access Colorado census tracts demographics.
Expand the tracts file and use these data as further described
at http://proximityone.com/tracts.htm
Colorado Census Block Demographics
... Access Colorado census block demographics.
See block level subject matter description: http://proximityone.com/dp2000et.htm
Schools & School Districts
Colorado School District Demographics
... basic Census 2000 demographics
... extended Census 2000 demographics (School District Special Tabulation)
... post-Census 2000 demographic updates
... Colorado School District Demographic Profiles
Map Files & GIS Tools
Colorado Map Files
... access Colorado-related map files for use in mapping applications.
... Gunnison County Area
Maps displayed on this page developed with Proximity CommunityViewer GIS software.
AmericasTrends
Colorado Census Bureau American Community Survey Profiles
... updated 2003 demographic estimates for Colorado.
Learn about Proximity AmericasTrends ... updates and extensions to the Census Bureau ACS.
[goto top]
|

