|
|
Census 2010 Main Page ZIP Code Data Resources Metro Rental Market Analysis |
ZIP Code Rental Market Characteristics & Pattern Analysis
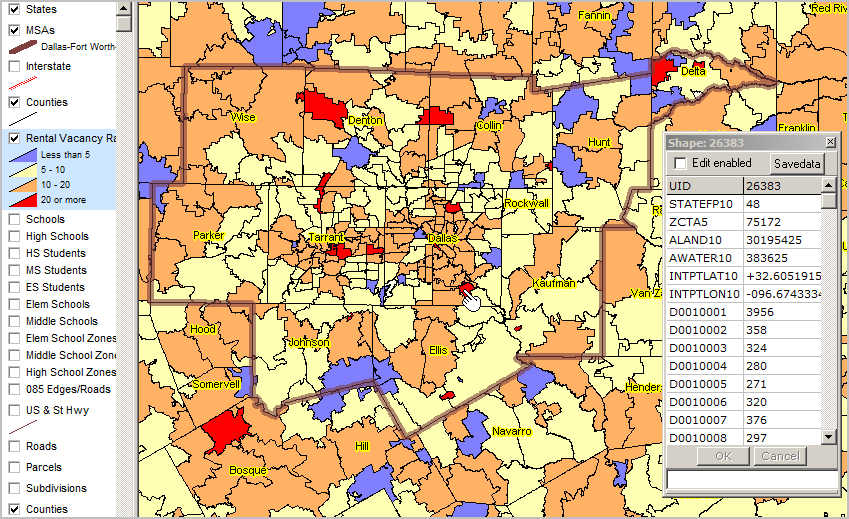
The graphic shown below illustrates use of the U.S. national scale Census 2010 ZIP Code Tabulation Area shapefile with integrated Census 2010 demographic profile subject matter items (details about this shapefile/data) to view/analyze rental vacancy rate patterns. The CommunityViewer GIS software (http://proximityone.com/cv.htm) is used to display a thematic map showing patterns of rental vacancy rates by 5-digit ZIP Code. The identify tool (see pointer) is used to select and display a mini-profile showing characteristics of this ZIP code area. The rental vacancy rate is the proportion of the rental inventory that is vacant "for rent." It is computed by dividing the number of vacant units "for rent" by the sum of the renter-occupied units, vacant units that are "for rent," and vacant units that have been rented but not yet occupied, and then multiplying by 100. Dallas, TX Metro Area Rental Vacancy Rate by ZIP Code  See additional map views illustrating use of Census 2010 & Census 2000 ZCTA geography: -- http://proximityone.com/gallery/guide/index.htm?census2010zcta.htm Additional Information Proximity develops geodemographic-economic data and analytical tools and helps organizations knit together and use diverse data in a decision-making and analytical framework. We develop custom demographic/economic estimates and projections, develop geographic and geocoded address files, and assist with impact and geospatial analyses. Wide-ranging organizations use our tools (software, data, methodologies) to analyze their own data integrated with other data. Contact Proximity (888-364-7656) with questions about data covered in this section or to discuss custom estimates, projections or analyses for your areas of interest. |
|
|