Bismarck Area

Contents
Selected CVXE GIS project/applications.
Click toggle in Table of Contents at left to view different geography/applications.
Join in the conversation (click to follow):
| • | accessing, integrating & using geographic, demographic, economic data |
| • | decision-making information resources & solutions. |
This section is focused on integrating Census 2010 TIGER Shapefiles with Census 2010, ACS and related data.
See related interactive ranking tables:
| • | North Dakota regional section: http://proximityone.com/srdmi/nddmi.htm |
| • | North Dakota school district profiles: http://proximityone.com/nd_sdc.htm |
See related interactive ranking tables:
| • | North Dakota school district demographics: http://proximityone.com/sd_nd.htm |
| • | North Dakota census tract demographics: http://proximityone.com/ustr0509_nd.htm |
| • | Census 2010 demographics: http://proximityone.com/cen2010_pl94171.htm |
(all US geography: state, congressional district, county, school district, city/place, metro)
Situation & Outlook Narrative Demographic-Economic Profiles (updated monthly)
-- http://proximityone.com/s&o_narrative_profiles.htm
Situation & Outlook Interactive Comparative Analysis Profiles
-- http://proximityone.com/s&o_comparative_profiles.htm
Selected Bismarck Area Views
More about metros and Situation & Outlook
| • | Metropolitan Area Guide: http://proximityone.com/metros/guide |
| • | MetroView: demographic-economic profiles & patterns -- http://proximityone.com/metroview.htm |
Project 1. Bismarck Area School Project Illustration Application
The CVXE GIS project is developed.
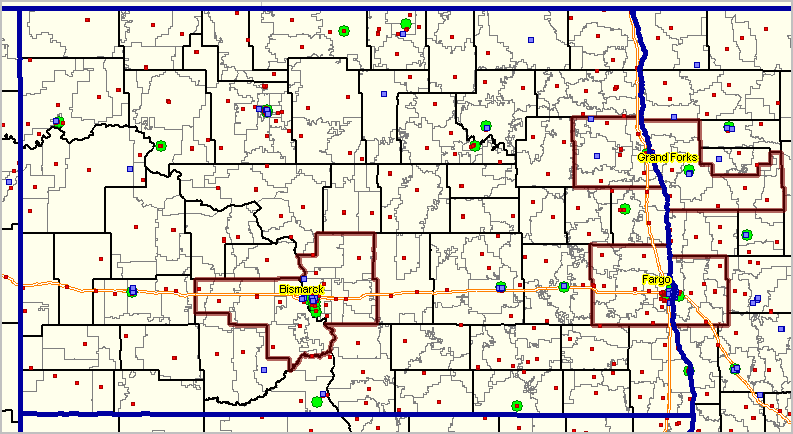
North Dakota showing metros (MSAs), counties (bold gray boundary), school districts (lighter gray), K-12 public schools (red markers),
K-12 private schools (blue markers), colleges (green markers) and Interstate highways. Next view shows zoom-in to Bismarck MSA.
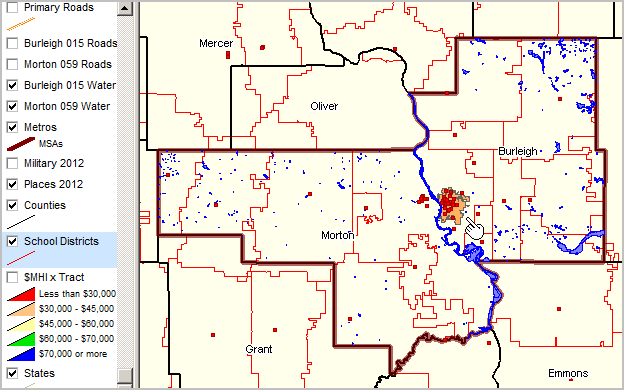
Bismarck city (orange, near pointer) shown in context of Bismarck metro, school districts (red boundary),
counties (gray boundary) and public K-12 schools (red markers). Next view shows zoom-in to Bismarck city.
Bismarck city (orange) in context of broader area. K-12 schools shown as red markers. Next view shows zoom-in to pointer location.

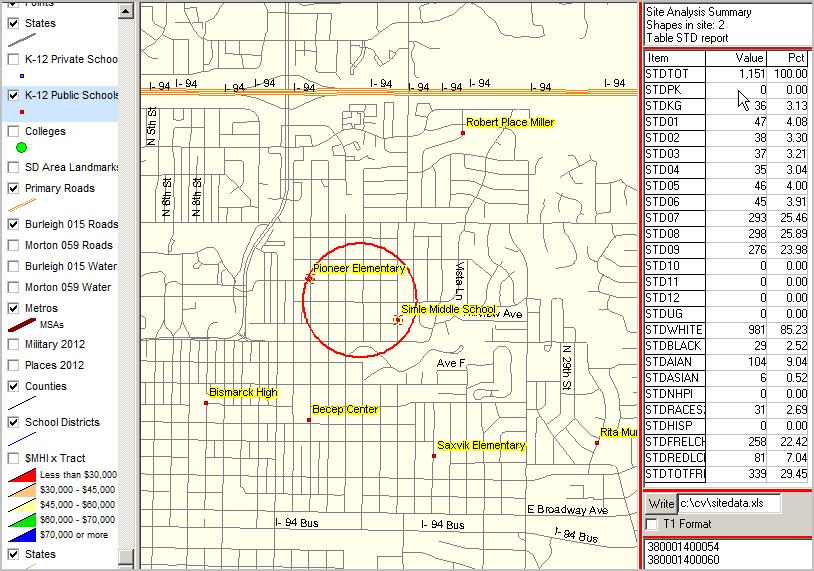
Next graphic illustrates use of CVXE Site Analysis tool. Two schools are selected using the "pick by circle tool.
The cumulative profile is shown in right grid (students by grade and race/ethnicity) -- sum of both schools.
School codes listed in lower listbox.
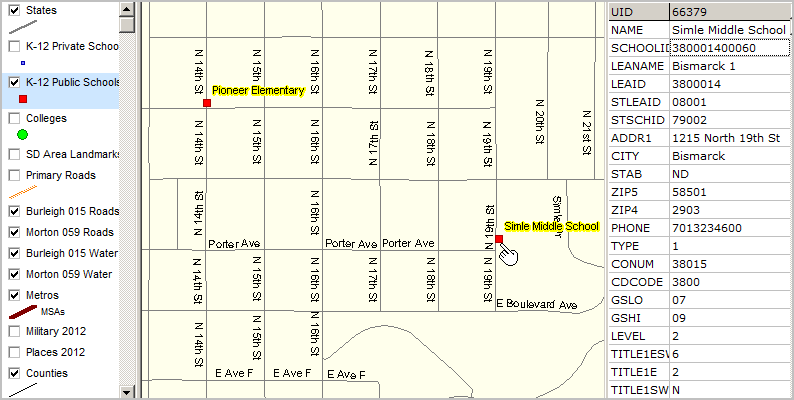
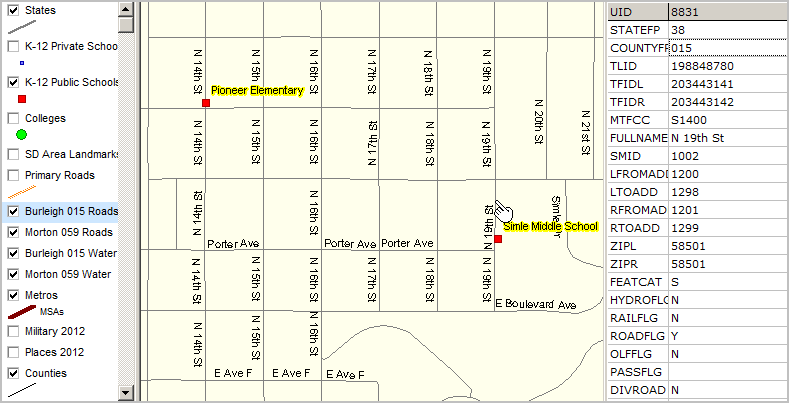
Further zoom-in illustrates use of identify tool to click on Simle school and show mini-profile.
Next view illustrates use of identify tool to click on street segment (intersection to intersection segment) where Simle school located.
Mini-profile shows attributes of the selected street segment. Left-side, right-side low and high address range and other fields
for use in location-based/routing operations.
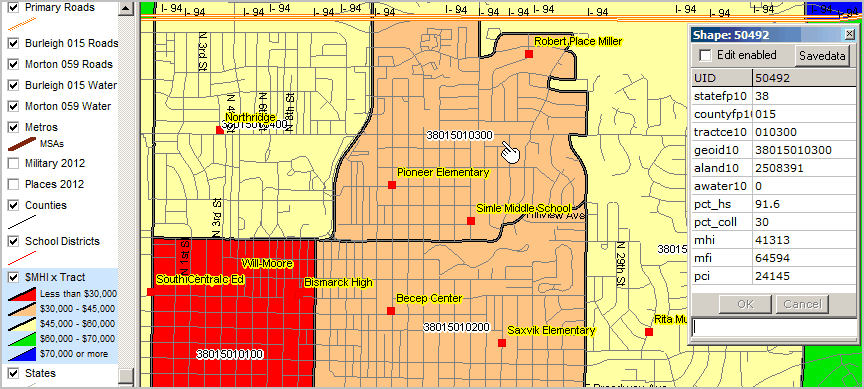
Next view shows zoom-out; illustrates adding thematic pattern of median household income by census tract.
Color legend shown in left panel. Tracts shown with bolded black boundary. Pointer near tract label for study tract (38-015-010300).
Identify tool used to click on study tract. Mini profile shows tract attributes including median household income,
median family income and per capita income. Thousands of demographics are available. The MHI for this tract is $41,313.
Project 2. Bismarck Area - Other Related Pattern Analysis Applications
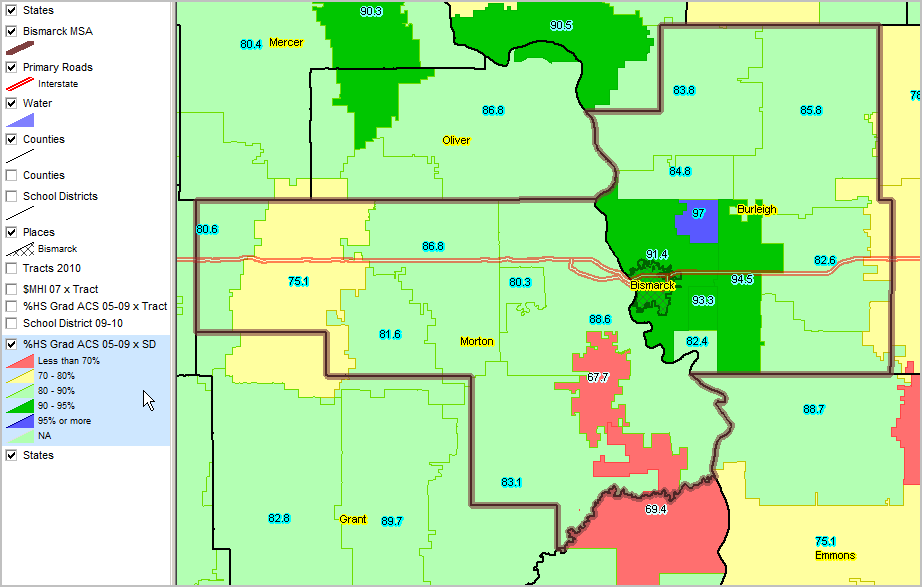
Educational Attainment by School District Percent high school graduate (population 25 years and over) by school district. Data based on 2009 American Community Survey (http://proximityone.com/acs.htm) 5-year estimates, centric to mid-2007.
Bismarck Metro bold brown boundary Bismarck city shown with cross-hatch pattern
|
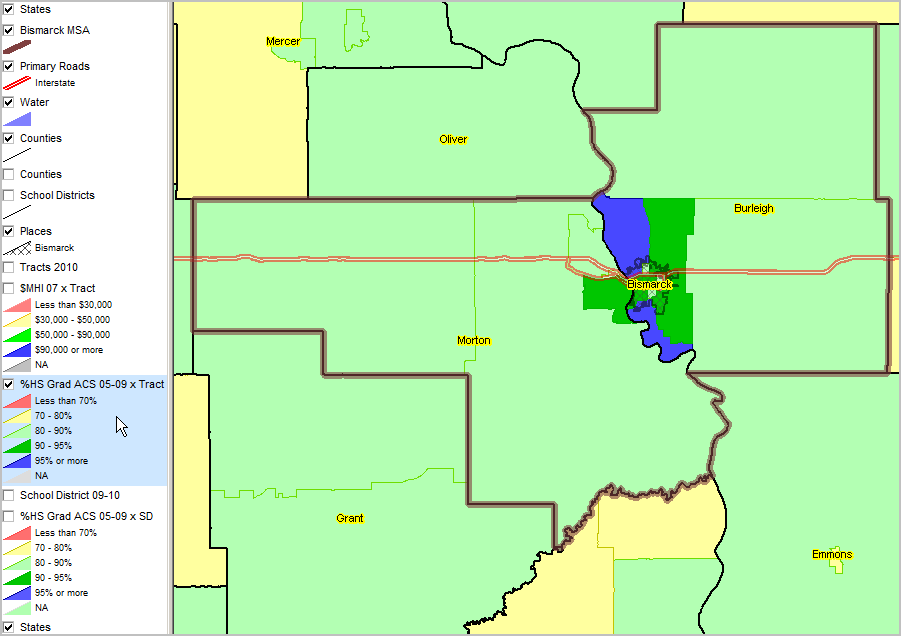
Educational Attainment by Census Tract Percent high school graduate (population 25 years and over) by census tract. Data based on 2009 American Community Survey (http://proximityone.com/acs.htm) 5-year estimates, centric to mid-2007.
Bismarck Metro bold brown boundary Bismarck city shown with cross-hatch pattern
|
Median Household Income ACS 2005-09 (mid-2007) ... using ACS census tract estimates released December 2010 (http://proximityone.com/acs.htm).
Bismarck Metro bold brown boundary Bismarck city shown with cross-hatch pattern
|
