Carmel, CA

Contents
Selected CV XE GIS project/application views in California.
Click toggle in Table of Contents at left to view sub-state applications.
Integrating shapefiles, ACS demographics, Census 2010 demographics, estimates & projections and related data.
See related interactive ranking tables:
| • | California school district demographics: http://proximityone.com/ca_sdc.htm |
| • | California census tract demographics: http://proximityone.com/tracts11dp1.htm |
| • | Census 2010 demographics: http://proximityone.com/s&o_comparative_profiles.htm |
(all US geography: state, congressional district, county, school district, city/place, metro)
Join the conversation .. ProximityOne on Twitter -- https://twitter.com/ProximityOne
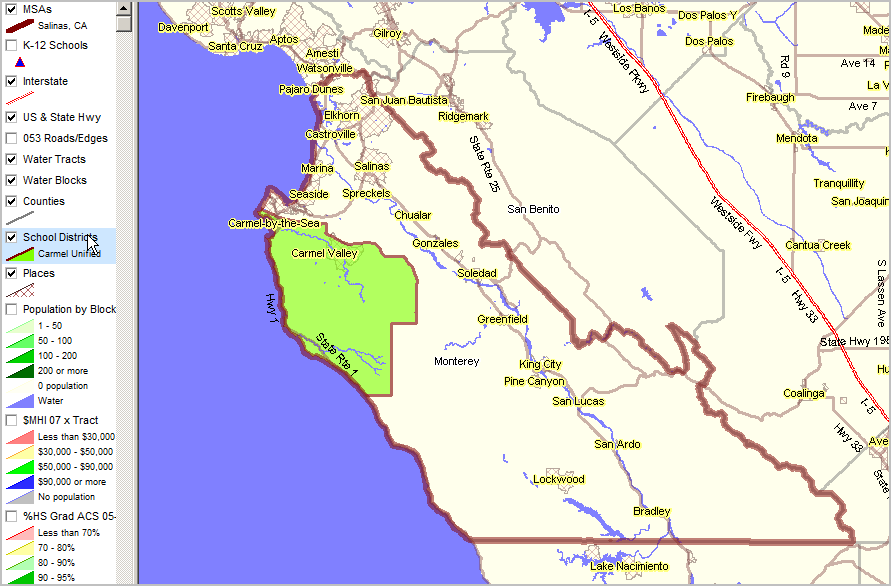
Carmel Area & School District in context of Salinas, CA MSA
More about metros and Situation & Outlook
| • | Metropolitan Area Guide: http://proximityone.com/metros/guide |
| • | MetroView: demographic-economic profiles & patterns -- http://proximityone.com/metroview.htm |
The table presented below provides a summary demographic profile for the city based on the Census 2010 P.L. 94-171 data. Similar to a profile developed by Census, this profile also includes two columns providing characteristics for the population under 18 years of age. These profiles are available for any Census 2010 geography, census block and higher level geography.
ProximityOne -- additional details and interactive ranking table
|
||||||||||||||||||||||||||||||||||||||||||||||||||||||||||||||||||||||||||||||||||||||||||||||||||||||||||||||||||||||||||||||||||||||||||||||||||||||||||||||||||||||||||||||||||||||||||||||||||||||||||
The table presented below provides a summary demographic profile for the place (CDP) based on the Census 2010 P.L. 94-171 data. Similar to a profile developed by Census, this profile also includes two columns providing characteristics for the population under 18 years of age. These profiles are available for any Census 2010 geography, census block and higher level geography.
ProximityOne -- additional details and interactive ranking table
|
||||||||||||||||||||||||||||||||||||||||||||||||||||||||||||||||||||||||||||||||||||||||||||||||||||||||||||||||||||||||||||||||||||||||||||||||||||||||||||||||||||||||||||||||||||||||||||||||||||||||||
The table presented below provides a summary demographic profile for the district based on the Census 2010 P.L. 94-171 data. Similar to a profile developed by Census, this profile also includes two columns providing characteristics for the population under 18 years of age. These profiles are available for any Census 2010 geography, census block and higher level geography.
ProximityOne -- additional details and interactive ranking table
|
||||||||||||||||||||||||||||||||||||||||||||||||||||||||||||||||||||||||||||||||||||||||||||||||||||||||||||||||||||||||||||||||||||||||||||||||||||||||||||||||||||||||||||||||||||||||||||||||||||||||||
The GIS project fileset used to develop the views shown below is available for your use. Add your own data; create alternative views. We can also provide custom map views or analyses to meet your needs. Contact us for details (888-364-7656).
Salinas, CA metro bold brown boundary. Carmel Unified School District green fill pattern. Cities/places diagonal cross-hatch pattern.
|
|
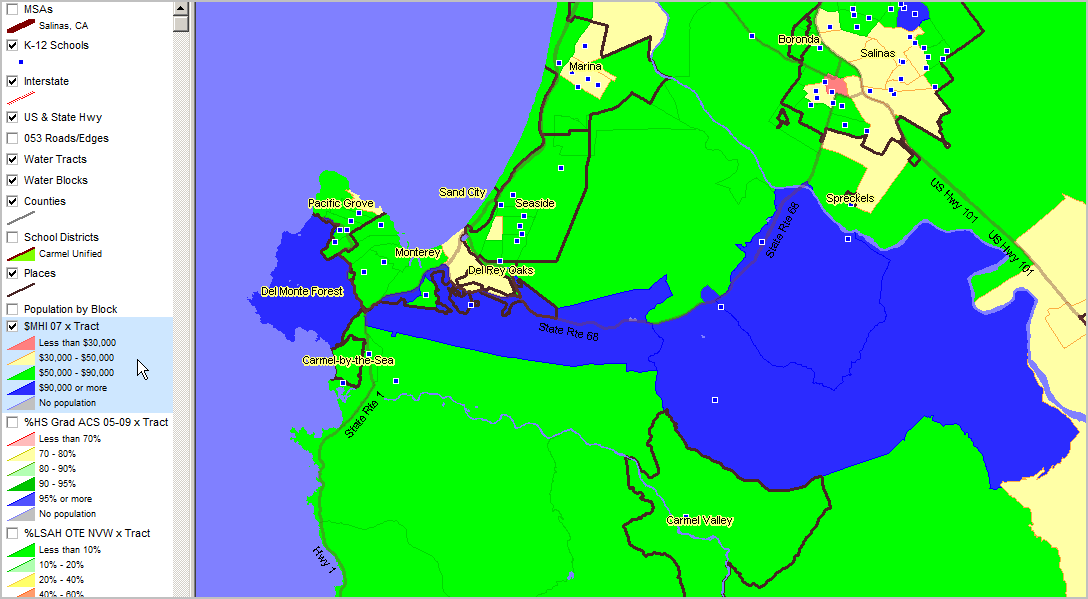
Median Household Income ACS 2005-09 (mid-2007) ... using ACS census tract estimates (http://proximityone.com/acs.htm). See interval/color pattern in highlighted layer (blue) in legend at left of map.
|
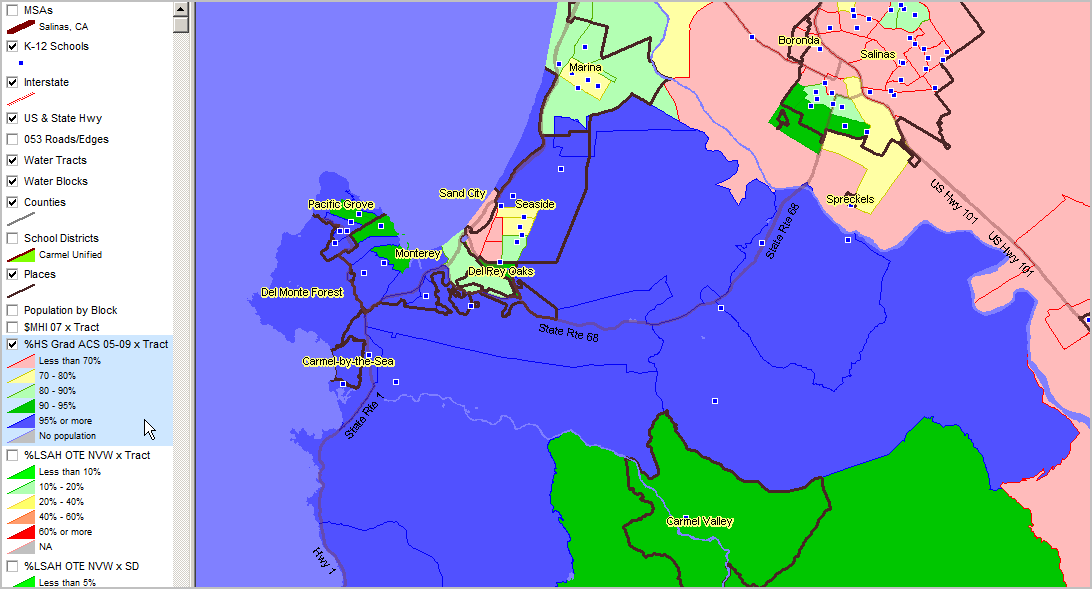
Percent high school graduate (population 25 years and over) by census tract. Data based on 2009 American Community Survey (http://proximityone.com/acs.htm) 5-year estimates, centric to mid-2007. See interval/color pattern in highlighted layer (blue) in legend at left of map.
|
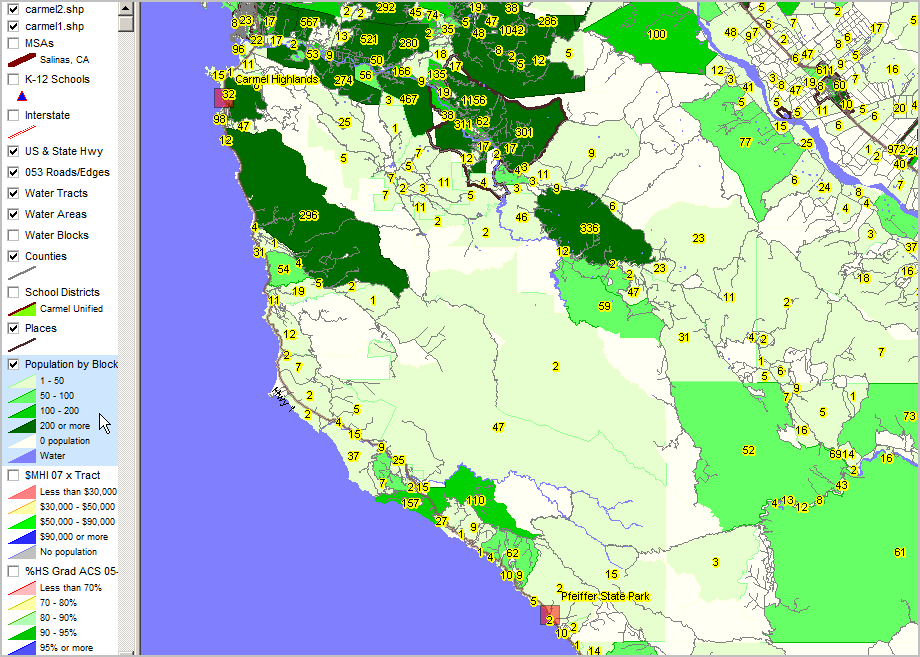
See highlighted (blue) layer in legend (left of map) for color/data value interval definitions. More about these data: http://proximityone.com/cen2010_blocks.htm.
|
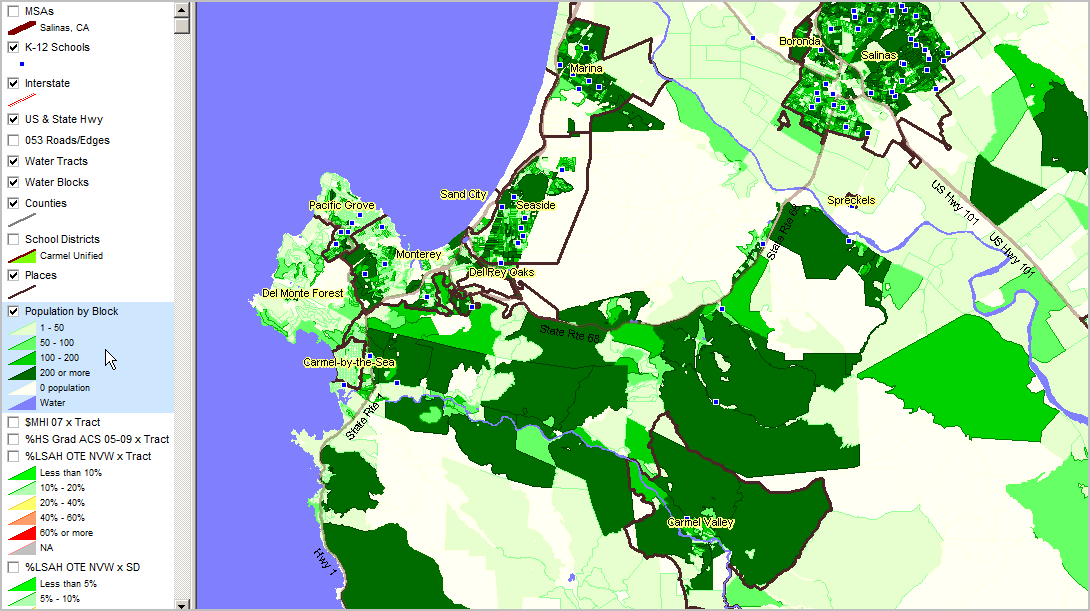
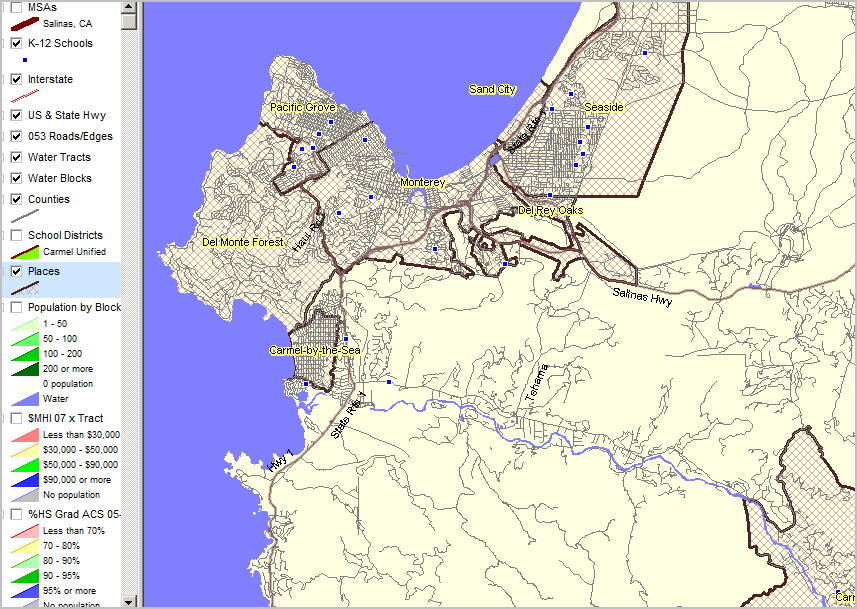
View similar to above showing total population by block as label. Intersection-to-intersection street detail and K-12 schools shown.
|
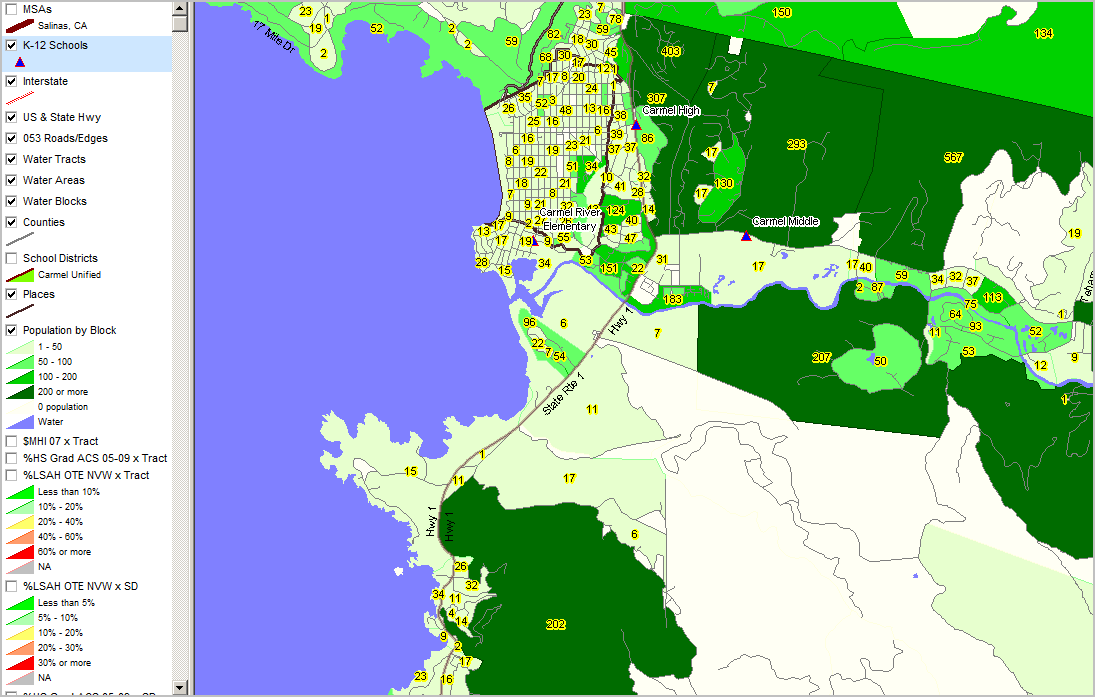
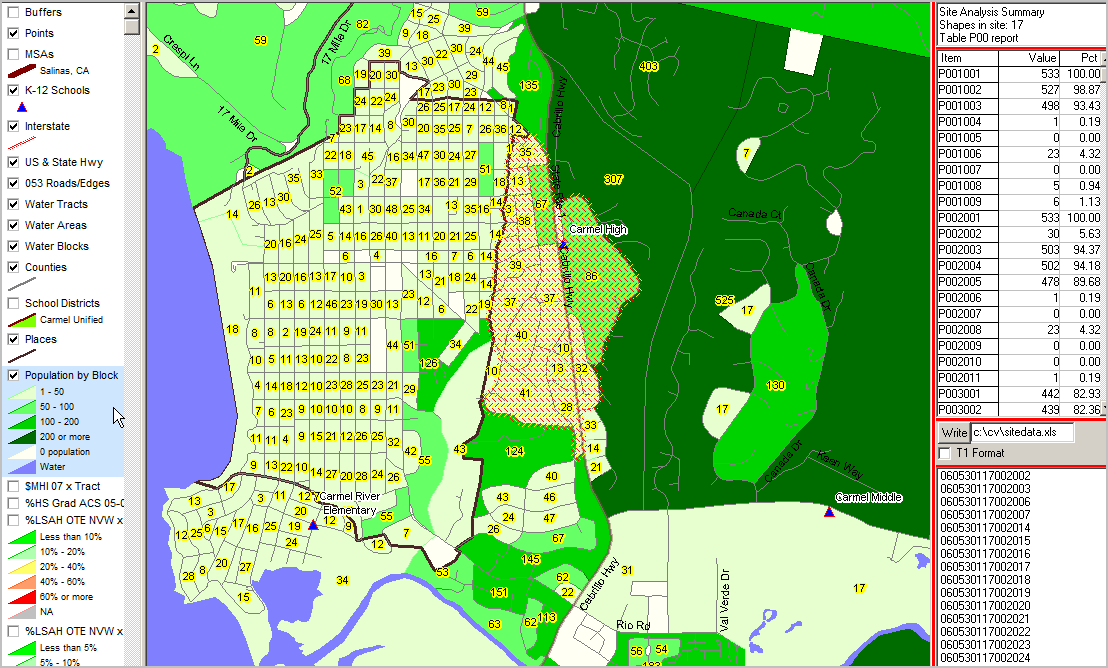
Further zoom-in ... CV Site Analysis operation applied to census block layer; blocks "cherry-picked" in vicinity of school. In the graphic below, table in upper right shows 17 blocks (cross-hatched) in this study area.
Aggregate demographics for selected blocks are shown in the mini table below that count: 533 total population in this set of blocks (p001001); 498 "White population of one race" (p001003) in this set of blocks. 30 Hispanic (p002002) and 503 non-Hispanic (p002003) Item names shown in left column of profile defined at http://proximityone.com/cen2010_blocks.htm.
List of geocodes for blocks included shown in lower right mini table. By clicking "Write" button, the summary data are written to specified spreadsheet file.
|