Honolulu County (003)

Contents
Selected CommunityViewer project/application views in Hawaii.
Navigate to sub-state areas: click on expanding text menu in left panel to view available sections.
The toggle graphic -- ![]() -- indicates an expanding section. Click the toggle or toggle line to view/close expanding sections.
-- indicates an expanding section. Click the toggle or toggle line to view/close expanding sections.
Integrating Census 2010 TIGER Shapefiles, ACS 2009 5-year demographics, Census 2010 demographics and related data..
See related interactive ranking tables:
| • | Hawaii census tract demographics: http://proximityone.com/ustr0509_hi.htm. |
| • | Census 2010 demographics: http://proximityone.com/cen2010_pl94171.htm |
(all US geography: state, congressional district, county, school district, city/place, metro)
The table presented below provides a summary demographic profile for the county based on the Census 2010 P.L. 94-171 data. Similar to a profile developed by Census, this profile also includes two columns providing characteristics for the population under 18 years of age. These profiles are available for any Census 2010 geography, census block and higher level geography.
ProximityOne -- additional details and interactive ranking table
|
||||||||||||||||||||||||||||||||||||||||||||||||||||||||||||||||||||||||||||||||||||||||||||||||||||||||||||||||||||||||||||||||||||||||||||||||||||||||||||||||||||||||||||||||||||||||||||||||||||||||||
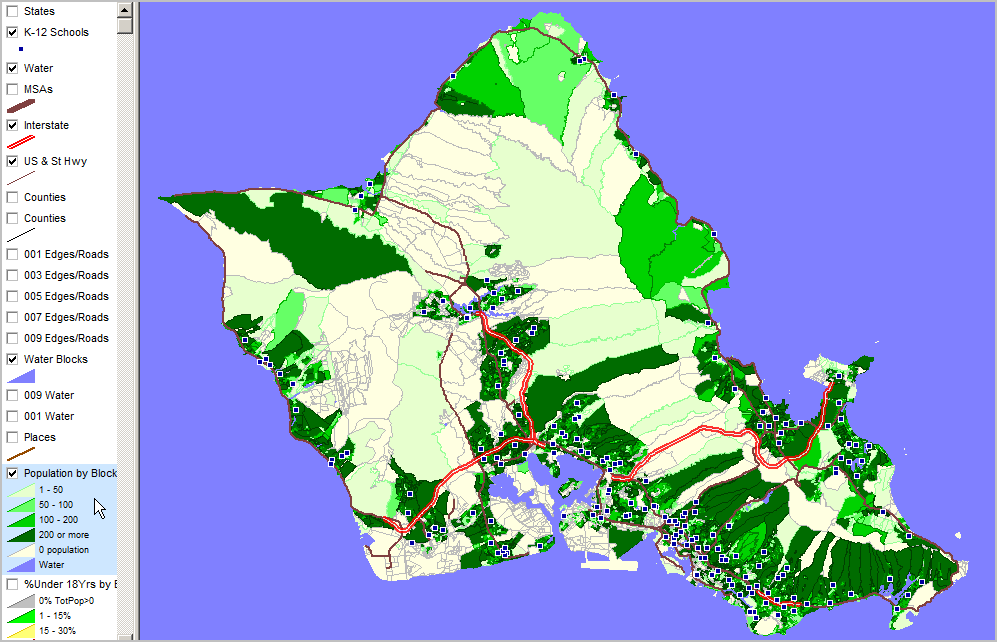
Census 2010 Census Block Demographics
See highlighted (blue) layer in legend (left of map) for color/data value interval definitions. More about these data: http://proximityone.com/cen2010_blocks.htm.
|
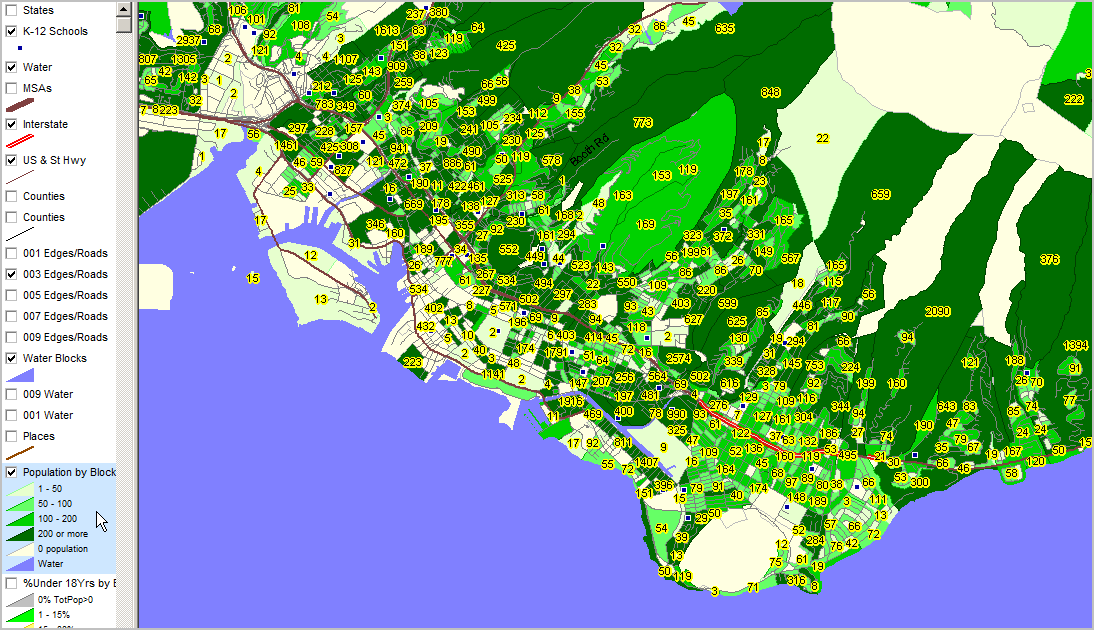
View similar to above showing total population by block as label. Intersection-to-intersection street detail and K-12 schools shown.
|
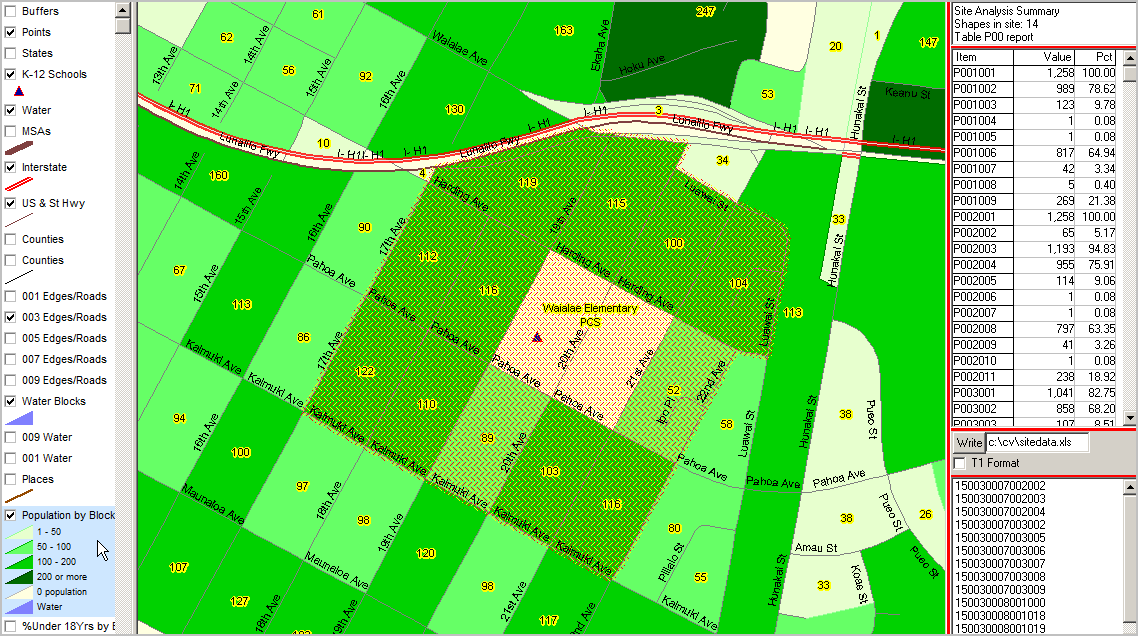
Further zoom-in ... CV Site Analysis operation applied to census block layer; "cherry-picked" blocks in school vicinity. In the graphic below, table in upper right shows 14 blocks (cross-hatched) in this study area.
Aggregate demographics for selected blocks are shown in the mini table below that count: 1,258 total population in this set of blocks (p001001); 817 "Asian population of one race" (p001006) in this set of blocks. 65 Hispanic (p002002) and 1,193 non-Hispanic (p002003) Item names shown in left column of profile defined at http://proximityone.com/cen2010_blocks.htm.
List of geocodes for blocks included shown in lower right mini table. By clicking "Write" button, the summary data are written to specified spreadsheet file.
|
Census Tract Demographic Patterns
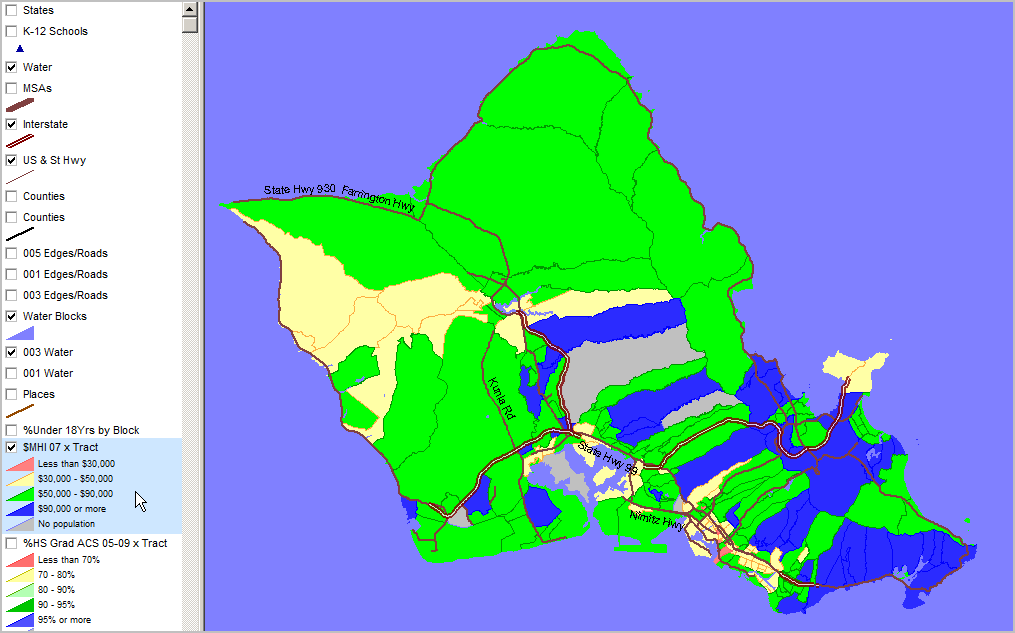
Median Household Income ACS 2005-09 (mid-2007) ... using ACS census tract estimates released December 2010 (http://proximityone.com/acs.htm). See highlighted (blue) layer in legend (left of map) for color/data value interval definitions.
|
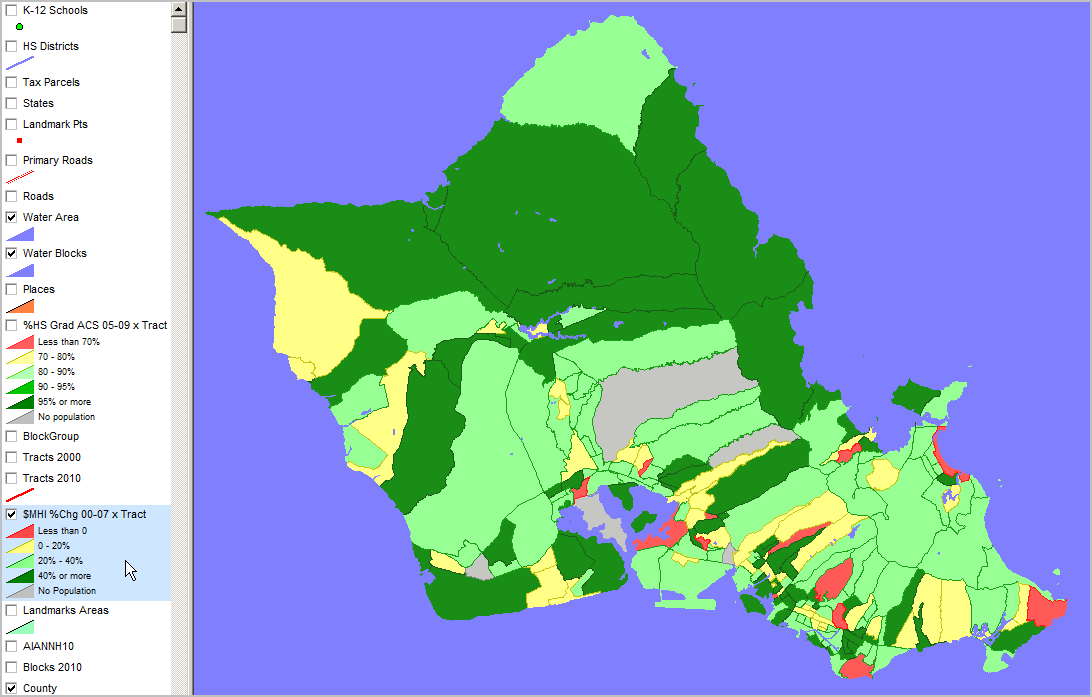
See pattern in legend at left of map view (blue highlighted layer). Percent change based on change from Census 2000 to ACS 2009 5-year estimate (centric to mid 2007).
|
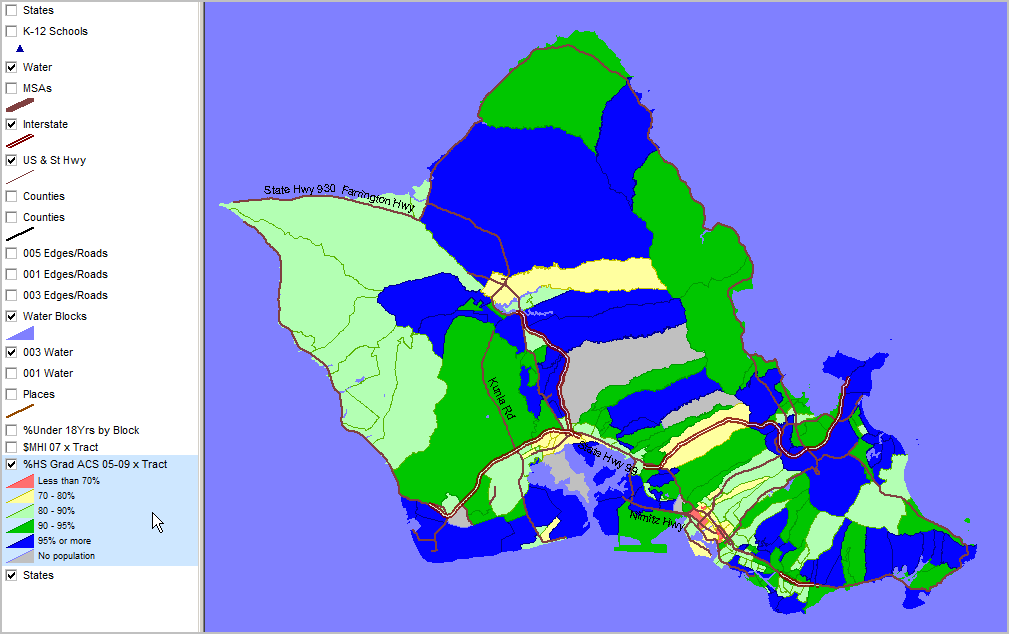
Educational Attainment by Census Tract Percent high school graduate (population 25 years and over) by census tract. Data based on 2009 American Community Survey (http://proximityone.com/acs.htm) 5-year estimates, centric to mid-2007. See highlighted (blue) layer in legend (left of map) for color/data value interval definitions.
|
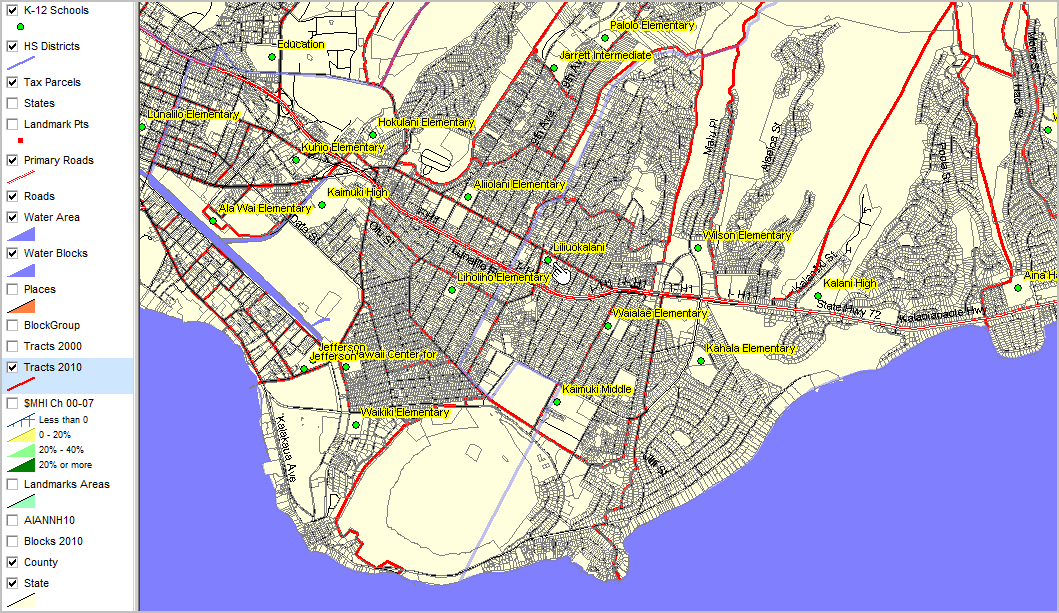
Integrating TIGER/Line Shapefiles with Multisourced Data
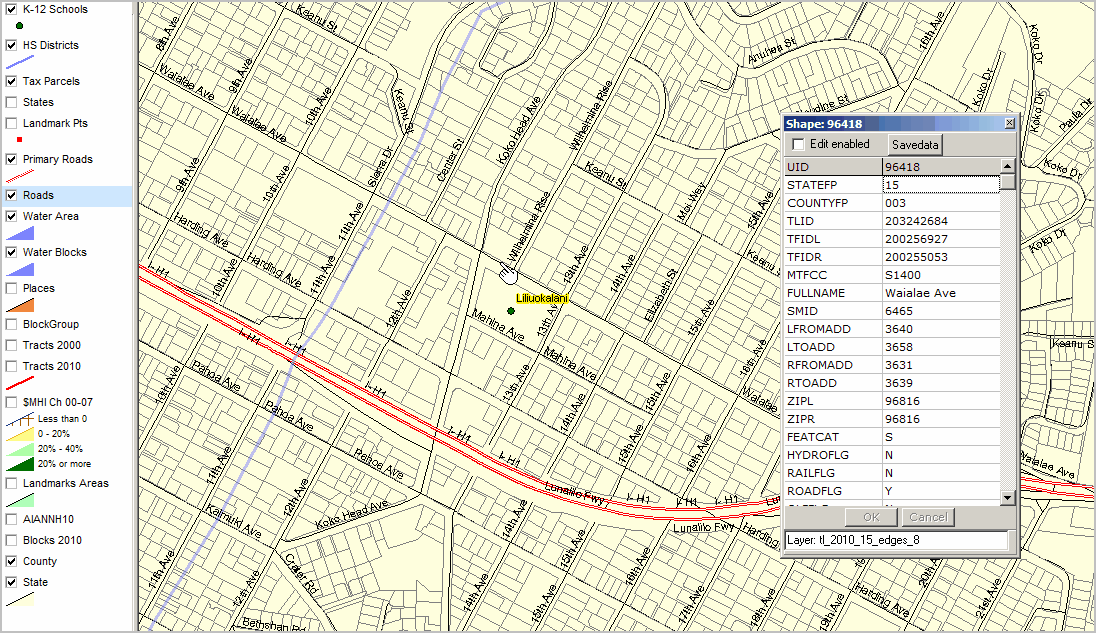
Integrating Census 2010 TIGER Shapefiles ... CV Identify tool (see pointer) used to show mini-profile of street segment. Tax parcels and schools (Hawaii DBEDT sourced) shown in context.
|
Zoom-out view with similar layers views as shown above (see pointer for same school location). Census 2010 census tracts shown in red.
|
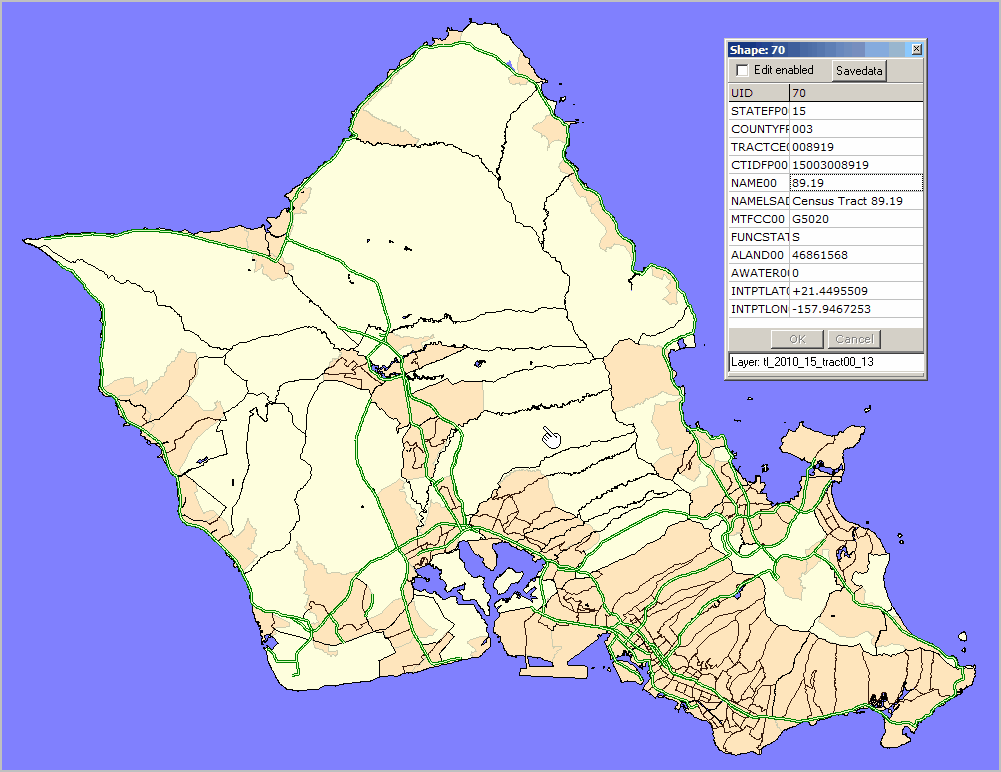
Census 2000 tract boundaries with black outline; compare tract 89.19 (pointer) with Census 2010 variation (next section)
|
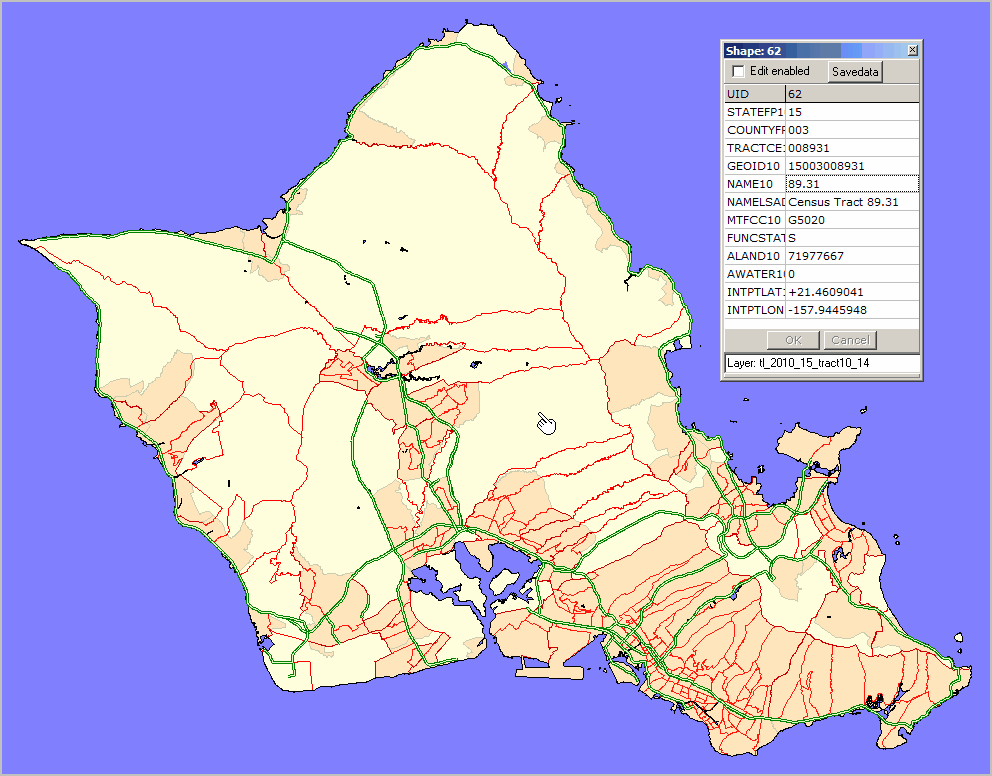
Census 2010 tract boundaries with red outline; compare tract 89.31 (pointer) with Census 2000 variation (above); mini-profile
|
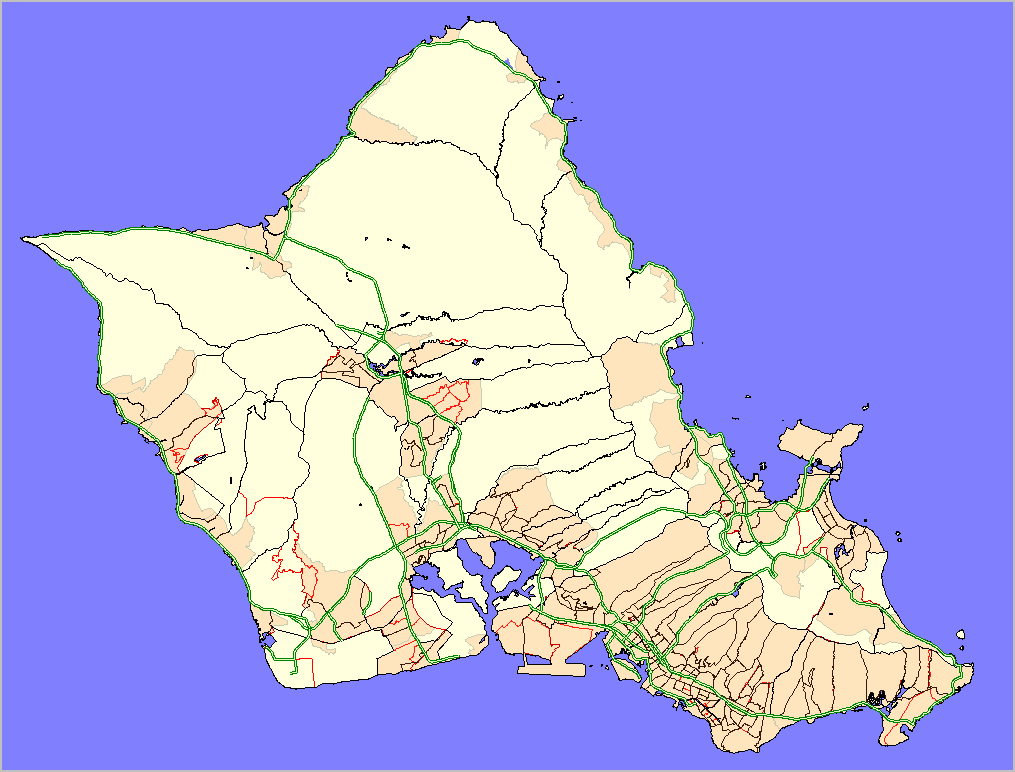
Census 2000 tract boundaries with black outline; Census 2010 tract boundaries with red outline
|
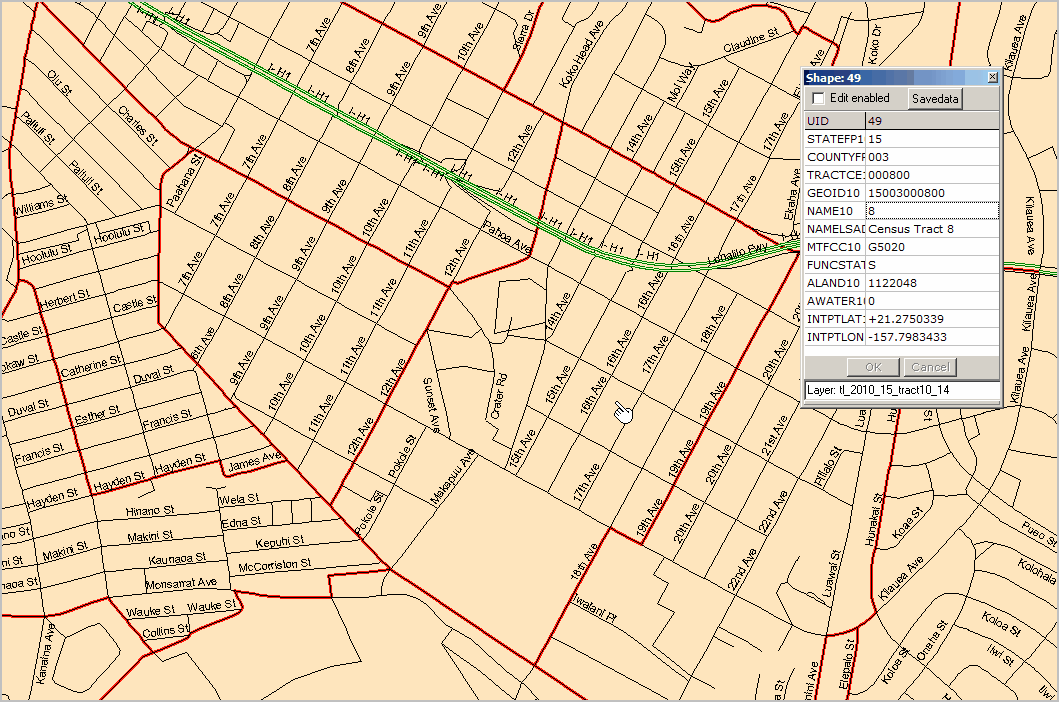
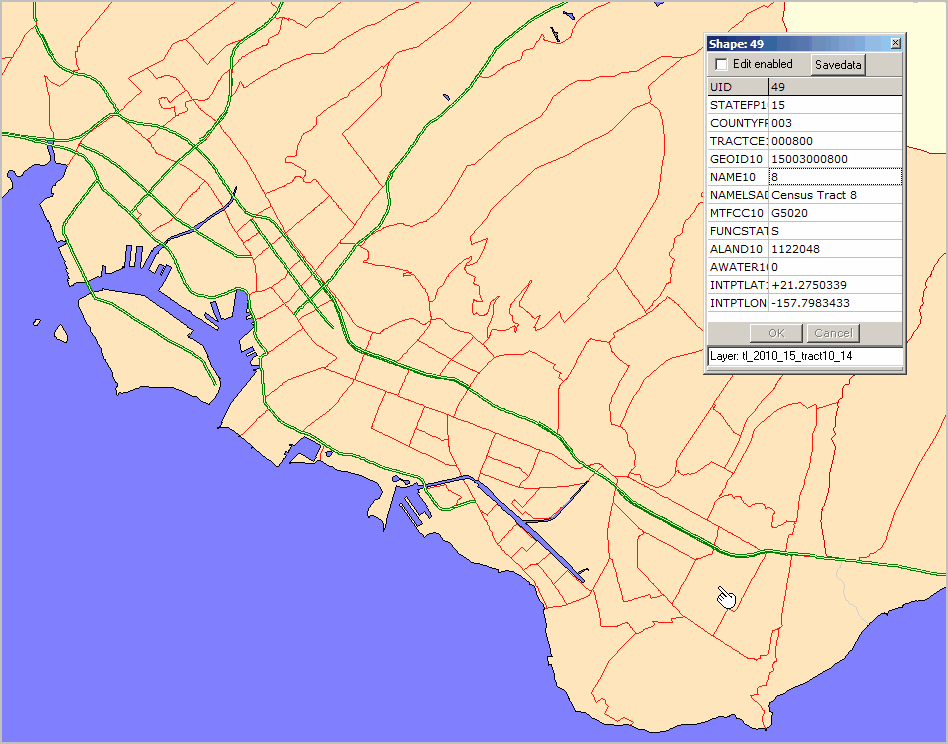
Census 2000 black boundaries; Tract 8 (pointer); mini-profile
Census 2010 red boundaries; Tract 8 (pointer); mini-profile
|

Zoom-in to Tract 8 showing streets and Census 2010 red tract boundaries; mini-profile
|