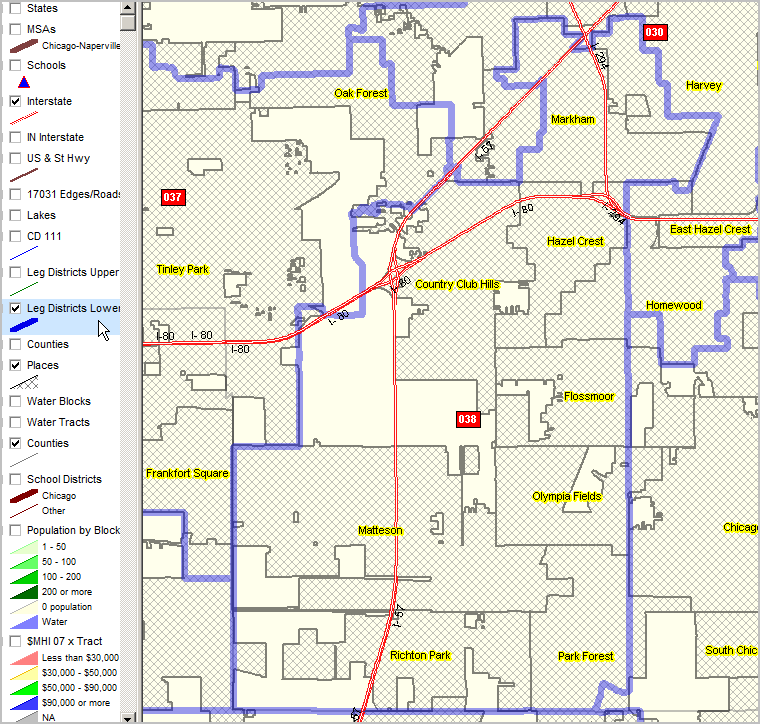
Census 2010 Demographic Profiles for Selected District 38 Places
Click to view table for selected place. Each toggle shows place code, place name and 2010 population.
Census 2010 PL94171 Demographic Profile -- Country Club Hills city, IL
Census 2010 P.L. 94-171 Profile -- Country Club Hills city, IL (IL0703364)
ProximityOne -- additional details and interactive ranking table
| Subject | Total | 18 years and over | Under 18 years | | Number | Percent | Number | Percent | Number | Percent |
| POPULATION |
| Total Population | 16,541 | 100.0 | 11,907 | 100.0 | 4,634 | 100.0 |
| RACE |
| One Race | 16,245 | 98.2 | 11,736 | 98.6 | 4,509 | 97.3 |
| White | 1,442 | 8.7 | 1,298 | 10.9 | 144 | 3.1 |
| Black or African American | 14,413 | 87.1 | 10,147 | 85.2 | 4,266 | 92.1 |
| American Indian and Alaska Native | 40 | 0.2 | 31 | 0.3 | 9 | 0.2 |
| Asian | 163 | 1.0 | 142 | 1.2 | 21 | 0.5 |
| Native Hawaiian and Other Pacific Islander | 6 | 0.0 | 2 | 0.0 | 4 | 0.1 |
| Some Other Race | 181 | 1.1 | 116 | 1.0 | 65 | 1.4 |
| Two or More Races | 296 | 1.8 | 171 | 1.4 | 125 | 2.7 |
HISPANIC OR LATINO AND RACE |
| Hispanic or Latino (of any race) | 461 | 2.8 | 269 | 2.3 | 192 | 4.1 |
| Not Hispanic or Latino | 16,080 | 97.2 | 11,638 | 97.7 | 4,442 | 95.9 |
| One Race | 15,854 | 95.8 | 11,491 | 96.5 | 4,363 | 94.2 |
| White | 1,343 | 8.1 | 1,222 | 10.3 | 121 | 2.6 |
| Black or African American | 14,299 | 86.4 | 10,092 | 84.8 | 4,207 | 90.8 |
| American Indian and Alaska Native | 34 | 0.2 | 25 | 0.2 | 9 | 0.2 |
| Asian | 162 | 1.0 | 142 | 1.2 | 20 | 0.4 |
| Native Hawaiian and Other Pacific Islander | 2 | 0.0 | 1 | 0.0 | 1 | 0.0 |
| Some Other Race | 14 | 0.1 | 9 | 0.1 | 5 | 0.1 |
| Two or More Races | 226 | 1.4 | 147 | 1.2 | 79 | 1.7 |
HOUSING UNITS |
| Total housing units | 6,102 | 100.0 | | | | |
OCCUPANCY STATUS |
| Occupied housing units | 5,662 | 92.8 | | | | |
| Vacant housing units | 440 | 7.2 | | | | |
Data source: Census 2010, P.L. 94-171 data files.
|
Census 2010 PL94171 Demographic Profile -- Flossmoor village, IL
Census 2010 P.L. 94-171 Profile -- Flossmoor village, IL (IL0704248)
ProximityOne -- additional details and interactive ranking table
| Subject | Total | 18 years and over | Under 18 years | | Number | Percent | Number | Percent | Number | Percent |
| POPULATION |
| Total Population | 9,464 | 100.0 | 7,022 | 100.0 | 2,442 | 100.0 |
| RACE |
| One Race | 9,248 | 97.7 | 6,901 | 98.3 | 2,347 | 96.1 |
| White | 4,393 | 46.4 | 3,521 | 50.1 | 872 | 35.7 |
| Black or African American | 4,521 | 47.8 | 3,108 | 44.3 | 1,413 | 57.9 |
| American Indian and Alaska Native | 7 | 0.1 | 6 | 0.1 | 1 | 0.0 |
| Asian | 240 | 2.5 | 216 | 3.1 | 24 | 1.0 |
| Native Hawaiian and Other Pacific Islander | 2 | 0.0 | 1 | 0.0 | 1 | 0.0 |
| Some Other Race | 85 | 0.9 | 49 | 0.7 | 36 | 1.5 |
| Two or More Races | 216 | 2.3 | 121 | 1.7 | 95 | 3.9 |
HISPANIC OR LATINO AND RACE |
| Hispanic or Latino (of any race) | 303 | 3.2 | 177 | 2.5 | 126 | 5.2 |
| Not Hispanic or Latino | 9,161 | 96.8 | 6,845 | 97.5 | 2,316 | 94.8 |
| One Race | 8,979 | 94.9 | 6,742 | 96.0 | 2,237 | 91.6 |
| White | 4,235 | 44.7 | 3,424 | 48.8 | 811 | 33.2 |
| Black or African American | 4,462 | 47.1 | 3,080 | 43.9 | 1,382 | 56.6 |
| American Indian and Alaska Native | 6 | 0.1 | 5 | 0.1 | 1 | 0.0 |
| Asian | 240 | 2.5 | 216 | 3.1 | 24 | 1.0 |
| Native Hawaiian and Other Pacific Islander | 2 | 0.0 | 1 | 0.0 | 1 | 0.0 |
| Some Other Race | 34 | 0.4 | 16 | 0.2 | 18 | 0.7 |
| Two or More Races | 182 | 1.9 | 103 | 1.5 | 79 | 3.2 |
HOUSING UNITS |
| Total housing units | 3,677 | 100.0 | | | | |
OCCUPANCY STATUS |
| Occupied housing units | 3,447 | 93.7 | | | | |
| Vacant housing units | 230 | 6.3 | | | | |
Data source: Census 2010, P.L. 94-171 data files.
|
Census 2010 PL94171 Demographic Profile -- Hazel Crest village, IL
Census 2010 P.L. 94-171 Profile -- Hazel Crest village, IL (IL0704905)
ProximityOne -- additional details and interactive ranking table
| Subject | Total | 18 years and over | Under 18 years | | Number | Percent | Number | Percent | Number | Percent |
| POPULATION |
| Total Population | 14,100 | 100.0 | 10,167 | 100.0 | 3,933 | 100.0 |
| RACE |
| One Race | 13,812 | 98.0 | 10,016 | 98.5 | 3,796 | 96.5 |
| White | 1,443 | 10.2 | 1,310 | 12.9 | 133 | 3.4 |
| Black or African American | 12,009 | 85.2 | 8,453 | 83.1 | 3,556 | 90.4 |
| American Indian and Alaska Native | 33 | 0.2 | 18 | 0.2 | 15 | 0.4 |
| Asian | 92 | 0.7 | 76 | 0.7 | 16 | 0.4 |
| Native Hawaiian and Other Pacific Islander | 0 | 0.0 | 0 | 0.0 | 0 | 0.0 |
| Some Other Race | 235 | 1.7 | 159 | 1.6 | 76 | 1.9 |
| Two or More Races | 288 | 2.0 | 151 | 1.5 | 137 | 3.5 |
HISPANIC OR LATINO AND RACE |
| Hispanic or Latino (of any race) | 527 | 3.7 | 317 | 3.1 | 210 | 5.3 |
| Not Hispanic or Latino | 13,573 | 96.3 | 9,850 | 96.9 | 3,723 | 94.7 |
| One Race | 13,341 | 94.6 | 9,722 | 95.6 | 3,619 | 92.0 |
| White | 1,269 | 9.0 | 1,197 | 11.8 | 72 | 1.8 |
| Black or African American | 11,935 | 84.6 | 8,421 | 82.8 | 3,514 | 89.3 |
| American Indian and Alaska Native | 26 | 0.2 | 14 | 0.1 | 12 | 0.3 |
| Asian | 91 | 0.6 | 76 | 0.7 | 15 | 0.4 |
| Native Hawaiian and Other Pacific Islander | 0 | 0.0 | 0 | 0.0 | 0 | 0.0 |
| Some Other Race | 20 | 0.1 | 14 | 0.1 | 6 | 0.2 |
| Two or More Races | 232 | 1.6 | 128 | 1.3 | 104 | 2.6 |
HOUSING UNITS |
| Total housing units | 5,431 | 100.0 | | | | |
OCCUPANCY STATUS |
| Occupied housing units | 5,003 | 92.1 | | | | |
| Vacant housing units | 428 | 7.9 | | | | |
Data source: Census 2010, P.L. 94-171 data files.
|
Census 2010 PL94171 Demographic Profile -- Homewood village, IL
Census 2010 P.L. 94-171 Profile -- Homewood village, IL (IL0705110)
ProximityOne -- additional details and interactive ranking table
| Subject | Total | 18 years and over | Under 18 years | | Number | Percent | Number | Percent | Number | Percent |
| POPULATION |
| Total Population | 19,323 | 100.0 | 14,584 | 100.0 | 4,739 | 100.0 |
| RACE |
| One Race | 18,799 | 97.3 | 14,345 | 98.4 | 4,454 | 94.0 |
| White | 11,498 | 59.5 | 9,266 | 63.5 | 2,232 | 47.1 |
| Black or African American | 6,594 | 34.1 | 4,600 | 31.5 | 1,994 | 42.1 |
| American Indian and Alaska Native | 22 | 0.1 | 15 | 0.1 | 7 | 0.1 |
| Asian | 274 | 1.4 | 217 | 1.5 | 57 | 1.2 |
| Native Hawaiian and Other Pacific Islander | 1 | 0.0 | 1 | 0.0 | 0 | 0.0 |
| Some Other Race | 410 | 2.1 | 246 | 1.7 | 164 | 3.5 |
| Two or More Races | 524 | 2.7 | 239 | 1.6 | 285 | 6.0 |
HISPANIC OR LATINO AND RACE |
| Hispanic or Latino (of any race) | 1,133 | 5.9 | 672 | 4.6 | 461 | 9.7 |
| Not Hispanic or Latino | 18,190 | 94.1 | 13,912 | 95.4 | 4,278 | 90.3 |
| One Race | 17,786 | 92.0 | 13,713 | 94.0 | 4,073 | 85.9 |
| White | 10,922 | 56.5 | 8,906 | 61.1 | 2,016 | 42.5 |
| Black or African American | 6,520 | 33.7 | 4,559 | 31.3 | 1,961 | 41.4 |
| American Indian and Alaska Native | 17 | 0.1 | 12 | 0.1 | 5 | 0.1 |
| Asian | 270 | 1.4 | 213 | 1.5 | 57 | 1.2 |
| Native Hawaiian and Other Pacific Islander | 1 | 0.0 | 1 | 0.0 | 0 | 0.0 |
| Some Other Race | 56 | 0.3 | 22 | 0.2 | 34 | 0.7 |
| Two or More Races | 404 | 2.1 | 199 | 1.4 | 205 | 4.3 |
HOUSING UNITS |
| Total housing units | 7,970 | 100.0 | | | | |
OCCUPANCY STATUS |
| Occupied housing units | 7,558 | 94.8 | | | | |
| Vacant housing units | 412 | 5.2 | | | | |
Data source: Census 2010, P.L. 94-171 data files.
|
Census 2010 PL94171 Demographic Profile -- Matteson village, IL
Census 2010 P.L. 94-171 Profile -- Matteson village, IL (IL0706294)
ProximityOne -- additional details and interactive ranking table
| Subject | Total | 18 years and over | Under 18 years | | Number | Percent | Number | Percent | Number | Percent |
| POPULATION |
| Total Population | 19,009 | 100.0 | 13,860 | 100.0 | 5,149 | 100.0 |
| RACE |
| One Race | 18,586 | 97.8 | 13,659 | 98.5 | 4,927 | 95.7 |
| White | 3,089 | 16.3 | 2,733 | 19.7 | 356 | 6.9 |
| Black or African American | 14,952 | 78.7 | 10,533 | 76.0 | 4,419 | 85.8 |
| American Indian and Alaska Native | 39 | 0.2 | 26 | 0.2 | 13 | 0.3 |
| Asian | 193 | 1.0 | 157 | 1.1 | 36 | 0.7 |
| Native Hawaiian and Other Pacific Islander | 9 | 0.0 | 8 | 0.1 | 1 | 0.0 |
| Some Other Race | 304 | 1.6 | 202 | 1.5 | 102 | 2.0 |
| Two or More Races | 423 | 2.2 | 201 | 1.5 | 222 | 4.3 |
HISPANIC OR LATINO AND RACE |
| Hispanic or Latino (of any race) | 813 | 4.3 | 494 | 3.6 | 319 | 6.2 |
| Not Hispanic or Latino | 18,196 | 95.7 | 13,366 | 96.4 | 4,830 | 93.8 |
| One Race | 17,870 | 94.0 | 13,207 | 95.3 | 4,663 | 90.6 |
| White | 2,784 | 14.6 | 2,535 | 18.3 | 249 | 4.8 |
| Black or African American | 14,833 | 78.0 | 10,474 | 75.6 | 4,359 | 84.7 |
| American Indian and Alaska Native | 13 | 0.1 | 9 | 0.1 | 4 | 0.1 |
| Asian | 187 | 1.0 | 155 | 1.1 | 32 | 0.6 |
| Native Hawaiian and Other Pacific Islander | 8 | 0.0 | 8 | 0.1 | 0 | 0.0 |
| Some Other Race | 45 | 0.2 | 26 | 0.2 | 19 | 0.4 |
| Two or More Races | 326 | 1.7 | 159 | 1.1 | 167 | 3.2 |
HOUSING UNITS |
| Total housing units | 7,086 | 100.0 | | | | |
OCCUPANCY STATUS |
| Occupied housing units | 6,735 | 95.0 | | | | |
| Vacant housing units | 351 | 5.0 | | | | |
Data source: Census 2010, P.L. 94-171 data files.
|
Census 2010 PL94171 Demographic Profile -- Olympia Fields village, IL
Census 2010 P.L. 94-171 Profile -- Olympia Fields village, IL (IL0707208)
ProximityOne -- additional details and interactive ranking table
| Subject | Total | 18 years and over | Under 18 years | | Number | Percent | Number | Percent | Number | Percent |
| POPULATION |
| Total Population | 4,988 | 100.0 | 4,037 | 100.0 | 951 | 100.0 |
| RACE |
| One Race | 4,893 | 98.1 | 3,979 | 98.6 | 914 | 96.1 |
| White | 1,261 | 25.3 | 1,203 | 29.8 | 58 | 6.1 |
| Black or African American | 3,468 | 69.5 | 2,640 | 65.4 | 828 | 87.1 |
| American Indian and Alaska Native | 7 | 0.1 | 6 | 0.1 | 1 | 0.1 |
| Asian | 117 | 2.3 | 99 | 2.5 | 18 | 1.9 |
| Native Hawaiian and Other Pacific Islander | 0 | 0.0 | 0 | 0.0 | 0 | 0.0 |
| Some Other Race | 40 | 0.8 | 31 | 0.8 | 9 | 0.9 |
| Two or More Races | 95 | 1.9 | 58 | 1.4 | 37 | 3.9 |
HISPANIC OR LATINO AND RACE |
| Hispanic or Latino (of any race) | 127 | 2.5 | 83 | 2.1 | 44 | 4.6 |
| Not Hispanic or Latino | 4,861 | 97.5 | 3,954 | 97.9 | 907 | 95.4 |
| One Race | 4,782 | 95.9 | 3,905 | 96.7 | 877 | 92.2 |
| White | 1,215 | 24.4 | 1,168 | 28.9 | 47 | 4.9 |
| Black or African American | 3,436 | 68.9 | 2,626 | 65.0 | 810 | 85.2 |
| American Indian and Alaska Native | 6 | 0.1 | 5 | 0.1 | 1 | 0.1 |
| Asian | 117 | 2.3 | 99 | 2.5 | 18 | 1.9 |
| Native Hawaiian and Other Pacific Islander | 0 | 0.0 | 0 | 0.0 | 0 | 0.0 |
| Some Other Race | 8 | 0.2 | 7 | 0.2 | 1 | 0.1 |
| Two or More Races | 79 | 1.6 | 49 | 1.2 | 30 | 3.2 |
HOUSING UNITS |
| Total housing units | 2,104 | 100.0 | | | | |
OCCUPANCY STATUS |
| Occupied housing units | 1,951 | 92.7 | | | | |
| Vacant housing units | 153 | 7.3 | | | | |
Data source: Census 2010, P.L. 94-171 data files.
|
Census 2010 PL94171 Demographic Profile -- Park Forest village, IL
Census 2010 P.L. 94-171 Profile -- Park Forest village, IL (IL0707414)
ProximityOne -- additional details and interactive ranking table
| Subject | Total | 18 years and over | Under 18 years | | Number | Percent | Number | Percent | Number | Percent |
| POPULATION |
| Total Population | 21,975 | 100.0 | 16,285 | 100.0 | 5,690 | 100.0 |
| RACE |
| One Race | 21,192 | 96.4 | 15,928 | 97.8 | 5,264 | 92.5 |
| White | 7,338 | 33.4 | 6,439 | 39.5 | 899 | 15.8 |
| Black or African American | 13,144 | 59.8 | 8,983 | 55.2 | 4,161 | 73.1 |
| American Indian and Alaska Native | 69 | 0.3 | 51 | 0.3 | 18 | 0.3 |
| Asian | 166 | 0.8 | 137 | 0.8 | 29 | 0.5 |
| Native Hawaiian and Other Pacific Islander | 10 | 0.0 | 9 | 0.1 | 1 | 0.0 |
| Some Other Race | 465 | 2.1 | 309 | 1.9 | 156 | 2.7 |
| Two or More Races | 783 | 3.6 | 357 | 2.2 | 426 | 7.5 |
HISPANIC OR LATINO AND RACE |
| Hispanic or Latino (of any race) | 1,407 | 6.4 | 890 | 5.5 | 517 | 9.1 |
| Not Hispanic or Latino | 20,568 | 93.6 | 15,395 | 94.5 | 5,173 | 90.9 |
| One Race | 19,981 | 90.9 | 15,125 | 92.9 | 4,856 | 85.3 |
| White | 6,759 | 30.8 | 6,022 | 37.0 | 737 | 13.0 |
| Black or African American | 12,977 | 59.1 | 8,907 | 54.7 | 4,070 | 71.5 |
| American Indian and Alaska Native | 37 | 0.2 | 27 | 0.2 | 10 | 0.2 |
| Asian | 157 | 0.7 | 132 | 0.8 | 25 | 0.4 |
| Native Hawaiian and Other Pacific Islander | 10 | 0.0 | 9 | 0.1 | 1 | 0.0 |
| Some Other Race | 41 | 0.2 | 28 | 0.2 | 13 | 0.2 |
| Two or More Races | 587 | 2.7 | 270 | 1.7 | 317 | 5.6 |
HOUSING UNITS |
| Total housing units | 9,838 | 100.0 | | | | |
OCCUPANCY STATUS |
| Occupied housing units | 8,750 | 88.9 | | | | |
| Vacant housing units | 1,088 | 11.1 | | | | |
Data source: Census 2010, P.L. 94-171 data files.
|
Census 2010 PL94171 Demographic Profile -- Richton Park village, IL
Census 2010 P.L. 94-171 Profile -- Richton Park village, IL (IL0707820)
ProximityOne -- additional details and interactive ranking table
| Subject | Total | 18 years and over | Under 18 years | | Number | Percent | Number | Percent | Number | Percent |
| POPULATION |
| Total Population | 13,646 | 100.0 | 9,783 | 100.0 | 3,863 | 100.0 |
| RACE |
| One Race | 13,298 | 97.4 | 9,599 | 98.1 | 3,699 | 95.8 |
| White | 1,733 | 12.7 | 1,523 | 15.6 | 210 | 5.4 |
| Black or African American | 11,244 | 82.4 | 7,833 | 80.1 | 3,411 | 88.3 |
| American Indian and Alaska Native | 15 | 0.1 | 12 | 0.1 | 3 | 0.1 |
| Asian | 136 | 1.0 | 109 | 1.1 | 27 | 0.7 |
| Native Hawaiian and Other Pacific Islander | 8 | 0.1 | 7 | 0.1 | 1 | 0.0 |
| Some Other Race | 162 | 1.2 | 115 | 1.2 | 47 | 1.2 |
| Two or More Races | 348 | 2.6 | 184 | 1.9 | 164 | 4.2 |
HISPANIC OR LATINO AND RACE |
| Hispanic or Latino (of any race) | 477 | 3.5 | 311 | 3.2 | 166 | 4.3 |
| Not Hispanic or Latino | 13,169 | 96.5 | 9,472 | 96.8 | 3,697 | 95.7 |
| One Race | 12,874 | 94.3 | 9,307 | 95.1 | 3,567 | 92.3 |
| White | 1,543 | 11.3 | 1,379 | 14.1 | 164 | 4.2 |
| Black or African American | 11,156 | 81.8 | 7,795 | 79.7 | 3,361 | 87.0 |
| American Indian and Alaska Native | 12 | 0.1 | 9 | 0.1 | 3 | 0.1 |
| Asian | 136 | 1.0 | 109 | 1.1 | 27 | 0.7 |
| Native Hawaiian and Other Pacific Islander | 8 | 0.1 | 7 | 0.1 | 1 | 0.0 |
| Some Other Race | 19 | 0.1 | 8 | 0.1 | 11 | 0.3 |
| Two or More Races | 295 | 2.2 | 165 | 1.7 | 130 | 3.4 |
HOUSING UNITS |
| Total housing units | 5,391 | 100.0 | | | | |
OCCUPANCY STATUS |
| Occupied housing units | 4,997 | 92.7 | | | | |
| Vacant housing units | 394 | 7.3 | | | | |
Data source: Census 2010, P.L. 94-171 data files.
|
|