NC Congressional Districts

Contents
Selected CommunityViewer project/application views in North Carolina.
Click toggle in Table of Contents at left to view sub-state applications.
Integrating Census 2010 TIGER Shapefiles, ACS 2009 5-year demographics, Census 2010 demographics and related data.
See related interactive ranking tables:
| • | North Carolina school district demographics: http://proximityone.com/sd_nc.htm. |
| • | North Carolina census tract demographics: http://proximityone.com/ustr0509_nc.htm. |
| • | Census 2010 demographics: http://proximityone.com/cen2010_pl94171.htm |
(all US geography: state, congressional district, county, school district, city/place, metro)
Congressional Districts ... http://proximityone.com/cd.htm
The table presented below provides a summary demographic profile for the state based on the Census 2010 P.L. 94-171 data. Similar to a profile developed by Census, this profile also includes two columns providing characteristics for the population under 18 years of age. These profiles are available for any Census 2010 geography, census block and higher level geography.
ProximityOne -- additional details and interactive ranking table
|
||||||||||||||||||||||||||||||||||||||||||||||||||||||||||||||||||||||||||||||||||||||||||||||||||||||||||||||||||||||||||||||||||||||||||||||||||||||||||||||||||||||||||||||||||||||||||||||||||||||||||
Navigate to sub-state areas: click on expanding text menu in left panel to view available sections.
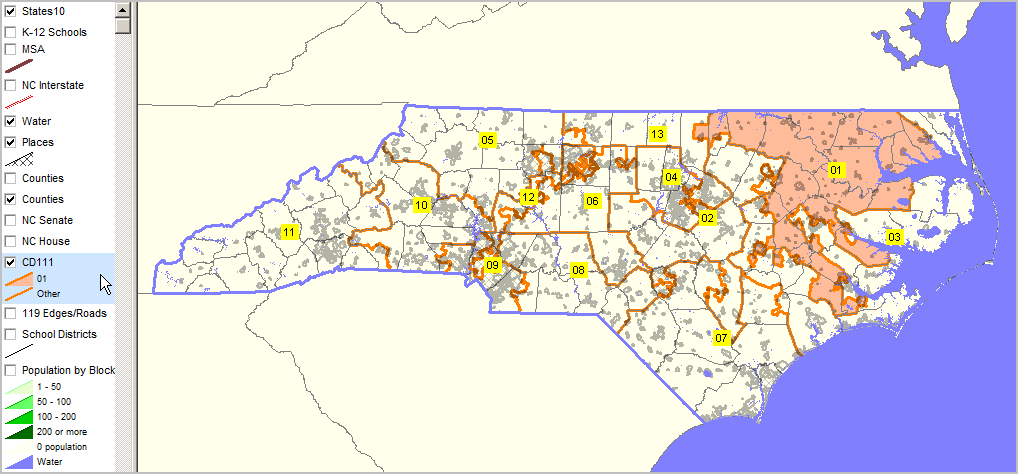
CD 111 #01 orange fill pattern. Cities/places gray hatch pattern.
|
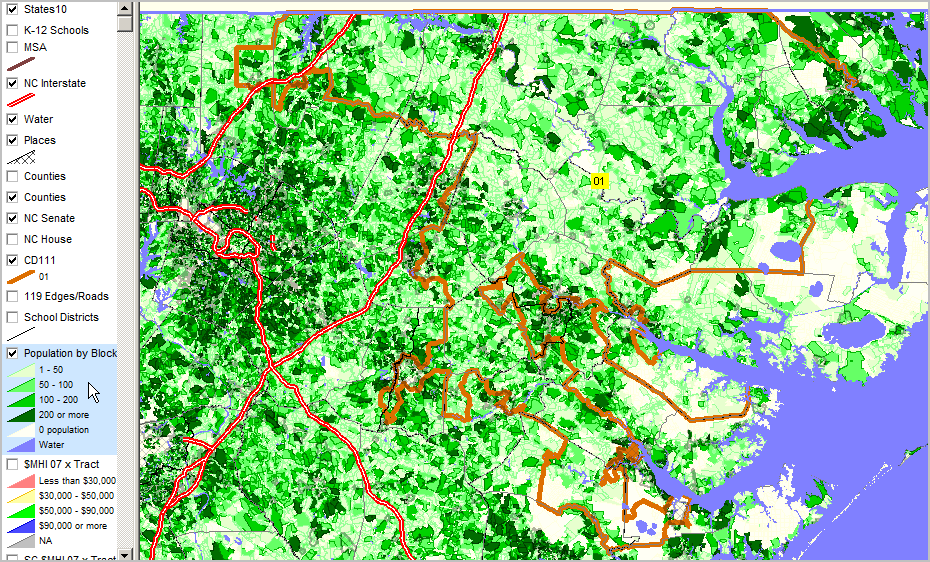
Zoom-in view of CD 111 NC #01 bold orange boundary. Cities/places gray hatch pattern. See highlighted (blue) layer in legend (left of map) for color/data value interval definitions. More about these data: http://proximityone.com/cen2010_blocks.htm.
|