Ohio Legislative Districts

Contents
Selected CVXE GIS project/applications in Ohio.
Click toggle in Table of Contents at left to view different geography/applications.
Join in the conversation (click to follow):
| • | accessing, integrating & using geographic, demographic, economic data |
| • | decision-making information resources & solutions. |
This section is focused on integrating Census 2010 TIGER Shapefiles with Census 2010, ACS and related data.
See related interactive ranking tables:
| • | Ohio regional section: http://proximityone.com/srdmi/ohdmi.htm |
| • | Ohio school district profiles: http://proximityone.com/oh_sdc.htm |
See related interactive ranking tables:
| • | Ohio school district demographics: http://proximityone.com/sd_oh.htm |
| • | Ohio census tract demographics: http://proximityone.com/ustr0509_oh.htm |
| • | Census 2010 demographics: http://proximityone.com/cen2010_pl94171.htm |
(all US geography: state, congressional district, county, school district, city/place, metro)
Situation & Outlook Narrative Demographic-Economic Profiles (updated monthly)
-- http://proximityone.com/s&o_narrative_profiles.htm
Situation & Outlook Interactive Comparative Analysis Profiles
-- http://proximityone.com/s&o_comparative_profiles.htm
Congressional District Demographics -- http://proximityone.com/cd.htm
Illustrative Census 2010 Demographic Profiles; Selected Ohio Legislative Districts
The table presented below provides a summary demographic profile for the district based on the Census 2010 P.L. 94-171 data. Similar to a profile developed by Census, this profile also includes two columns providing characteristics for the population under 18 years of age. These profiles are available for any Census 2010 geography, census block and higher level geography.
ProximityOne -- additional details and interactive ranking table
|
||||||||||||||||||||||||||||||||||||||||||||||||||||||||||||||||||||||||||||||||||||||||||||||||||||||||||||||||||||||||||||||||||||||||||||||||||||||||||||||||||||||||||||||||||||||||||||||||||||||||||
The GIS project fileset used to develop the views shown below is available for your use. Add your own data; create alternative views. We can also provide custom map views or analyses to meet your needs. Contact us for details (888-364-7656).
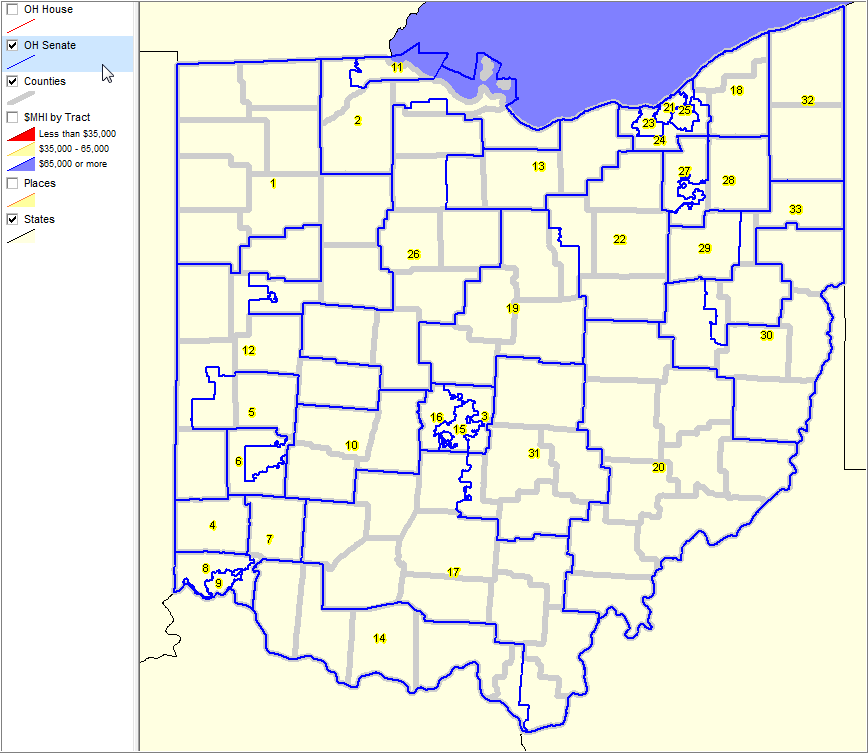
County boundaries gray, bold outline; state senate districts blue boundary with senate district number as label
|
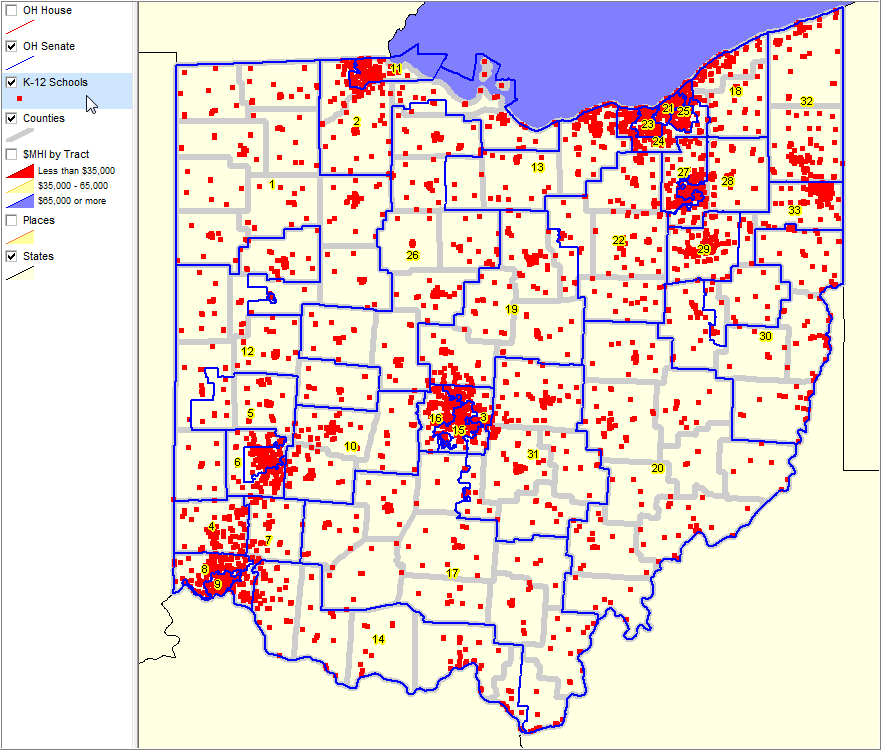
County boundaries gray, bold outline; state senate districts blue boundary with senate district number as label (view as above) K-12 schools shown as red markers.
|
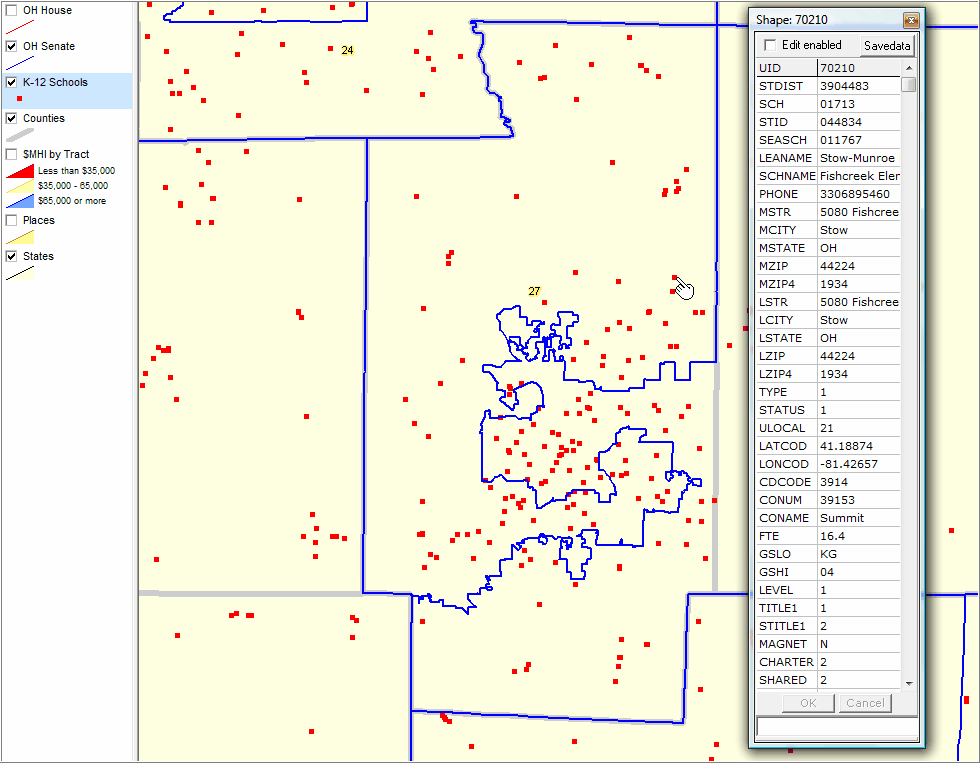
Similar to previous view with zoom-in; illustrates use of CV identify tool to display mini-profile of selected school (see pointer) attributes.
|
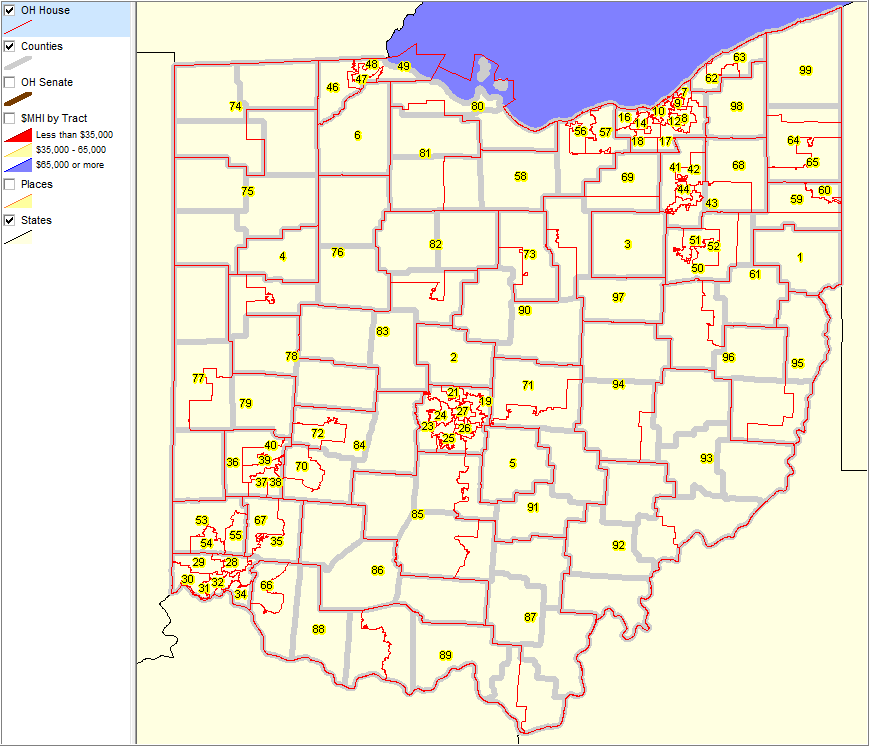
County boundaries gray, bold outline; state house districts red boundary with house district number as label
|
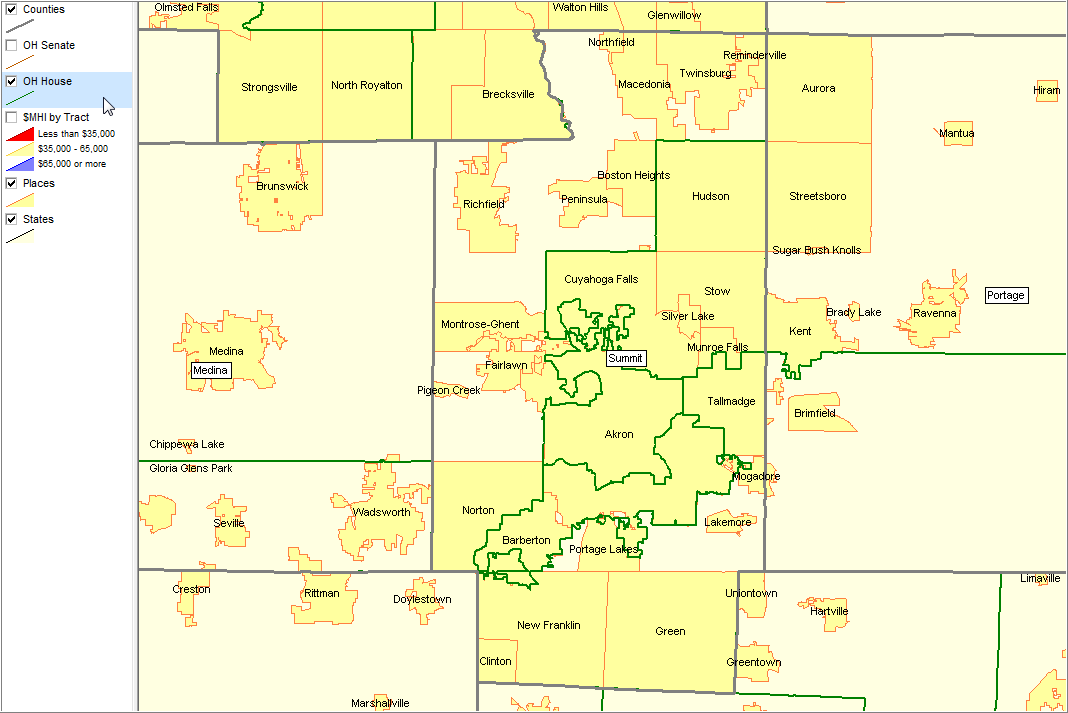
House districts shown with green boundaries; places (labeled) yellow fill pattern; county bold gray boundary
|
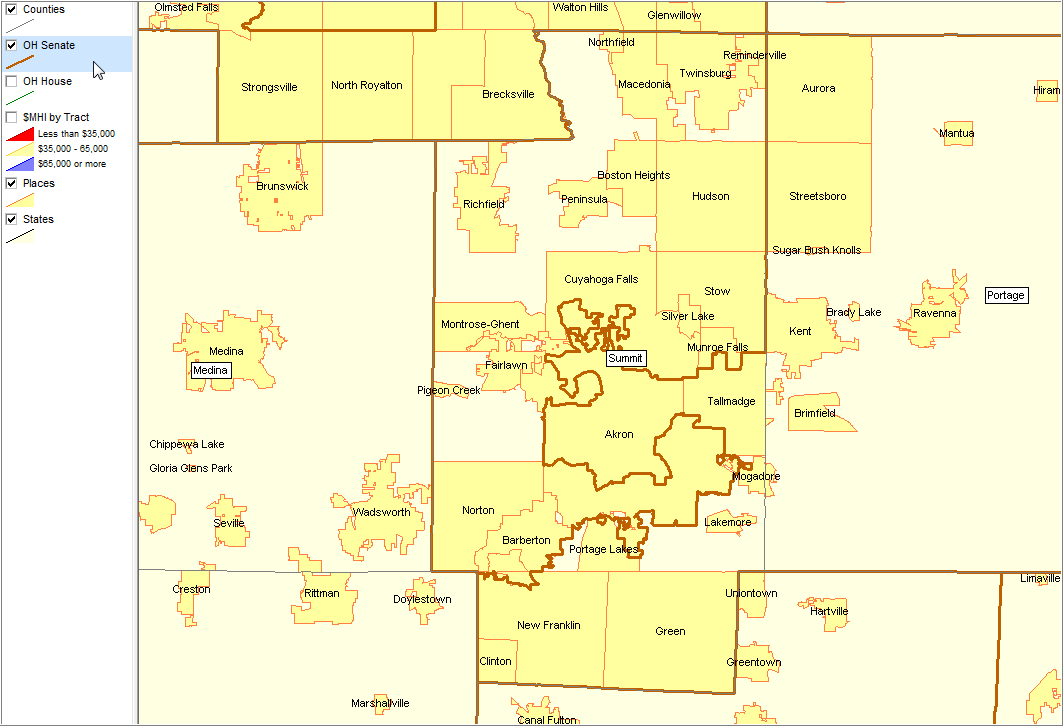
Senate districts shown with red/brown boundaries; places (labeled) with yellow fill pattern; county bold gray boundary
|
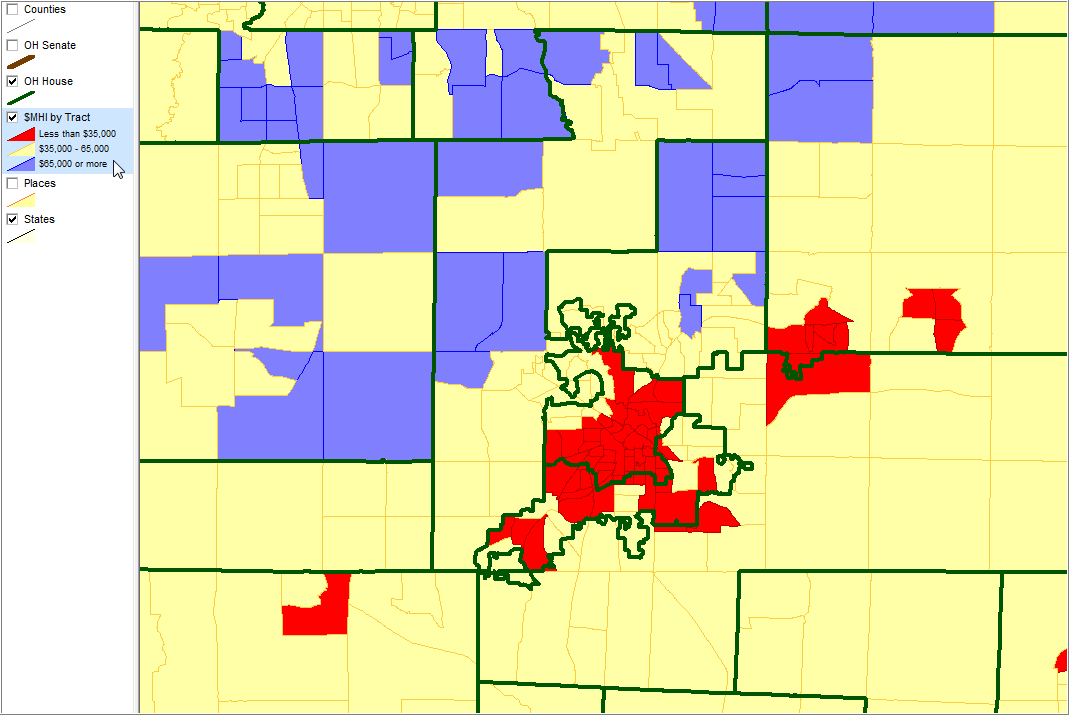
House legislative districts (green, bold) layed onto thematic map of median household income by census tract
|
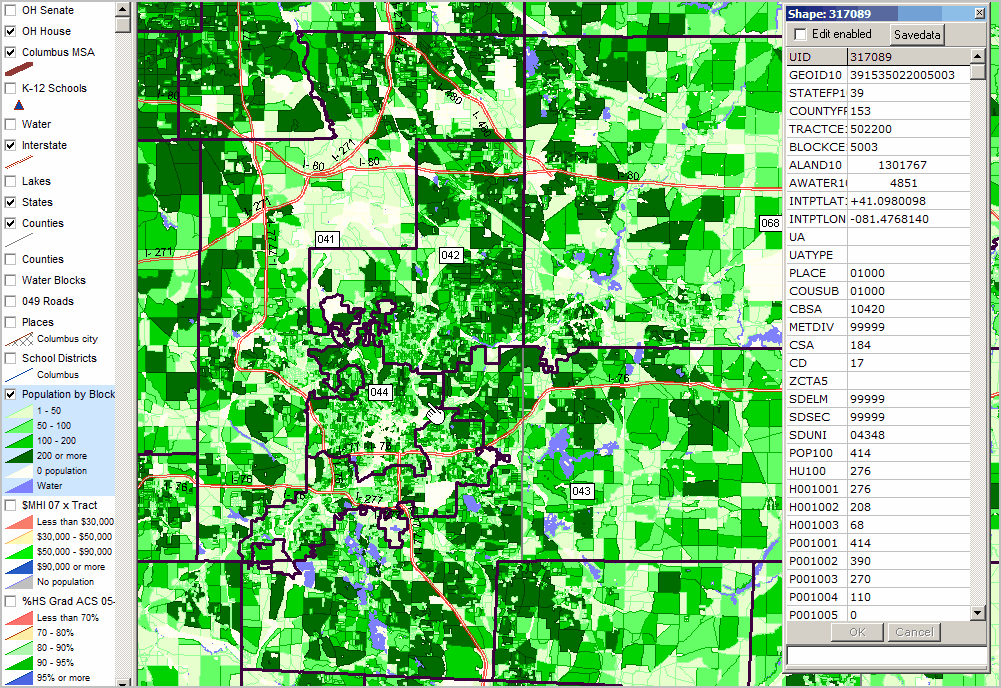
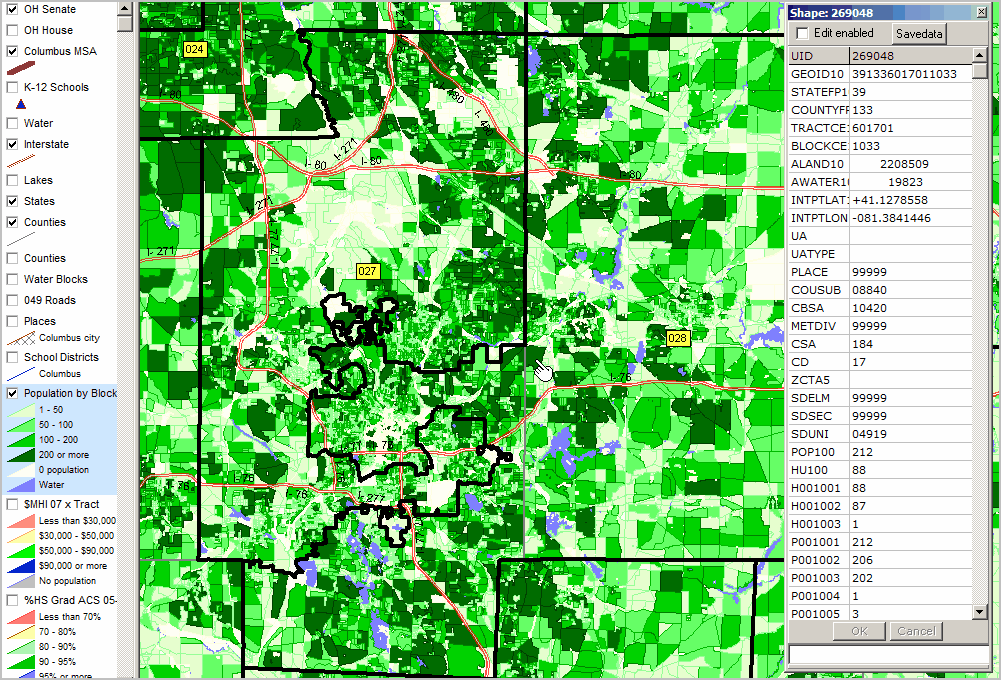
Senate district bold black boundary with yellow district number label. Census 2010 total population patterns -- see blue highlighted layer in legend at left of map for color/number interval. CV identify tool used to profile selected block (see pointer). Table at right shows partial item list.
Selected block has 212 total population and 202 "White population of one race" (p001003). Item names shown in left column of profile defined at http://proximityone.com/cen2010_blocks.htm. Contact us (888-364-7656) for more information.
|
House district bold black boundary with white district number label. Census 2010 total population patterns -- see blue highlighted layer in legend at left of map for color/number interval. CV identify tool used to profile selected block (see pointer). Table at right shows partial item list.
Selected block has 414 total population and 270 "White population of one race" (p001003). Item names shown in left column of profile defined at http://proximityone.com/cen2010_blocks.htm. Contact us (888-364-7656) for more information.
|