Austin ISD, TX

Contents
Selected CV XE GIS project/application views in Texas.
Click toggle in Table of Contents at left to view sub-state applications.
Integrating shapefiles, ACS demographics, Census 2010 demographics, estimates & projections and related data.
See related interactive ranking tables:
| • | Texas school district demographics: http://proximityone.com/tx_sdc.htm. |
| • | Texas census tract demographics: http://proximityone.com/tracts11dp1.htm. |
| • | Census 2010 demographics: http://proximityone.com/s&o_comparative_profiles.htm |
(all US geography: state, congressional district, county, school district, city/place, metro)
Join the conversation .. ProximityOne on Twitter -- https://twitter.com/ProximityOne
The toggle graphic -- ![]() -- indicates an expanding section. Click the toggle or toggle line to view/close expanding sections.
-- indicates an expanding section. Click the toggle or toggle line to view/close expanding sections.
Compare Waco ISD - Pearland ISD - Texas ACS 2009 3-year estimates -- open this spreadsheet
-- 4 sheet spreadsheet file: demographic, social, economic, housing profiles
General Population and Housing Characteristics: Census 2010
Comparative Analysis based on Demographic Profile Summary File -- http://proximityone.com/cen2010_dpsf.htm (May 2011)
- Austin city - Austin MSA - Texas -- http://proximityone.com/cen2010/dp/dpcn10tx16005000.htm
Demographic-Economic Profiles: ACS 2009
Comparative Analysis based on ACS 2009 -- http://proximityone.com/acs.htm
- Austin city - Round Rock city - Texas -- http://proximityone.com/acs/dp09/dpac09tx16005000.htm
Children's Demographics by Type of Enrollment
Age distributions by type of enrollment universe
Data centric to mid-2007 are based on the ACS 2009 School District Special Tabulation released May 2011
- Austin ISD, TX -- http://proximityone.com/sdst/b010014808940.htm
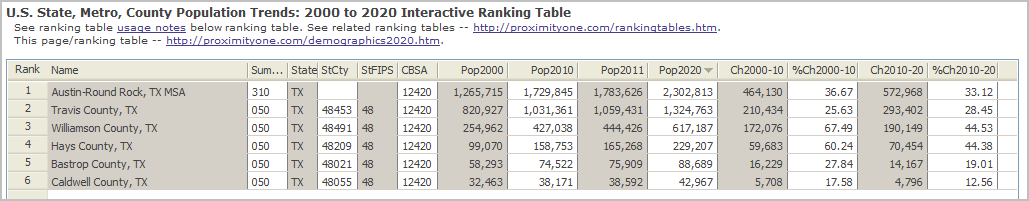
Austin Metro & County Population Projections to 2020
The following graphic shows the Austin-Round Rock-San Marcos MSA population projections by county to 2020.
The table is ranked on the projected 2020 total population. Projections reflect Census 2010 results.
See http://proximityone.com/demographics2020.htm to interactively rank on different columns and/or view other areas in the U.S.
Visual Analysis of Demographic/Economic Characteristics & Patterns
The GIS project fileset used to develop the views shown below is available for your use. Add your own data; create alternative views. We can also provide custom map views or analyses to meet your needs. Contact us for details (888-364-7656).
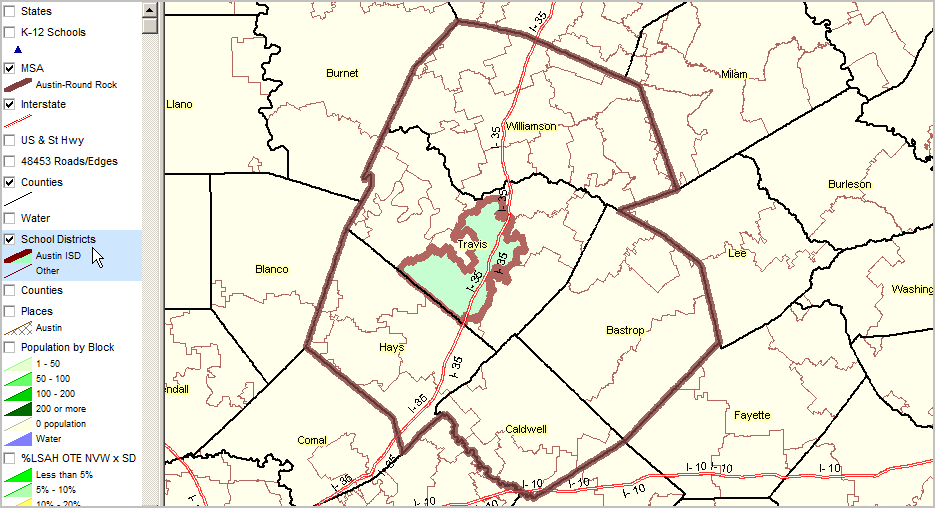
Austin ISD bold brown boundary green fill pattern in context of Austin-Round Rock, TX MSA (bold brown semi-transparent boundary)
|
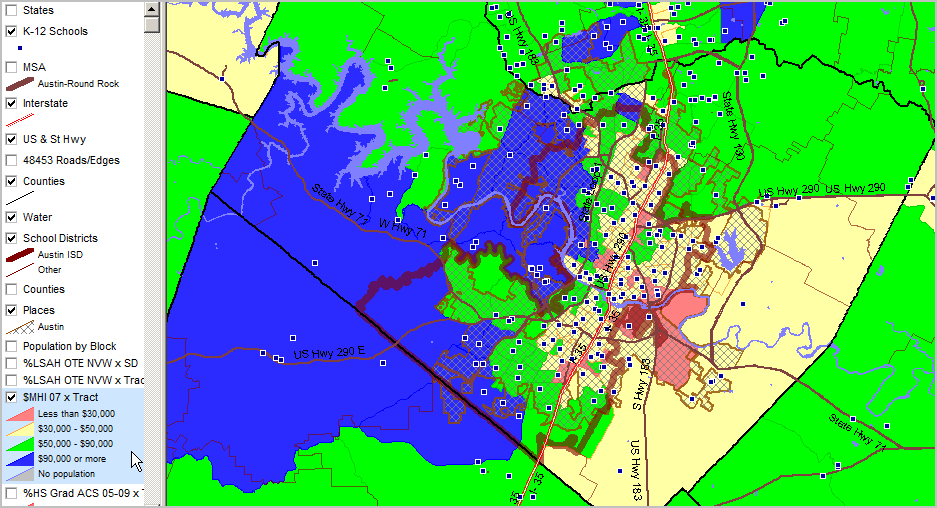
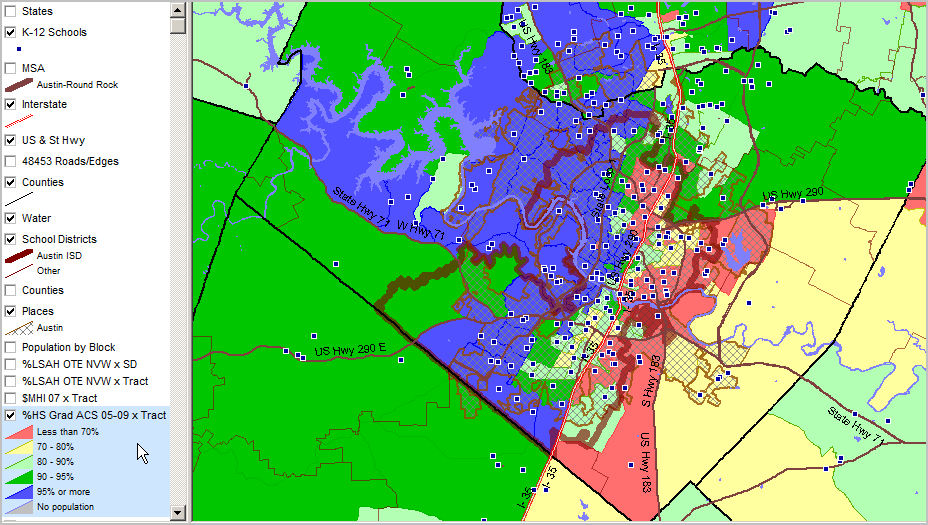
Median Household Income ACS 2005-09 (mid-2007) ... using ACS census tract estimates released December 2010 (http://proximityone.com/acs.htm). See highlighted (blue) layer in legend (left of map) for color/data value interval definitions. K-12 schools blue markers. Austin city diagonal cross-hatch pattern.
|
Percent high school graduate (population 25 years and over) by school district. Data based on 2009 American Community Survey (http://proximityone.com/acs.htm) 5-year estimates, centric to mid-2007. See highlighted (blue) layer in legend (left of map) for color/data value interval definitions.
|
See highlighted (blue) layer in legend (left of map) for color/data value interval definitions. More about these data: http://proximityone.com/cen2010_blocks.htm.
|
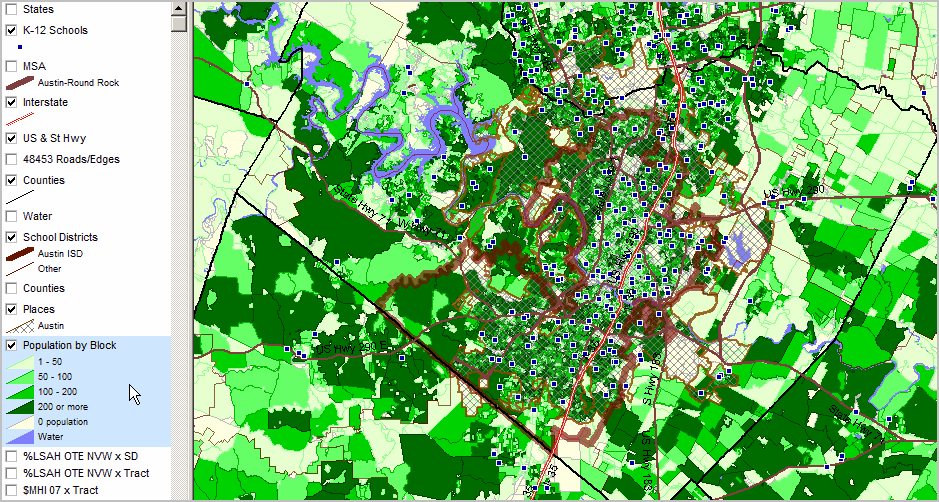
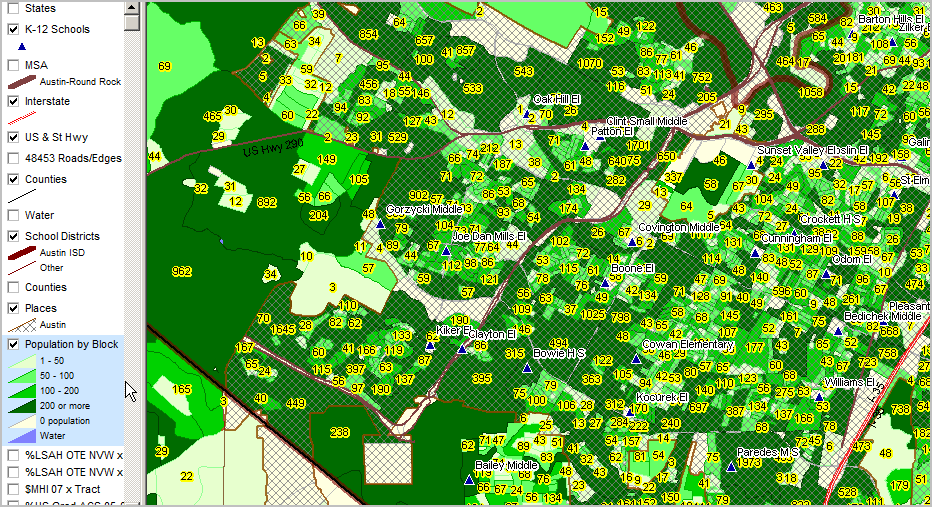
Zoom-in view, similar to above showing total population by block as label. Intersection-to-intersection street detail and K-12 schools shown.
|
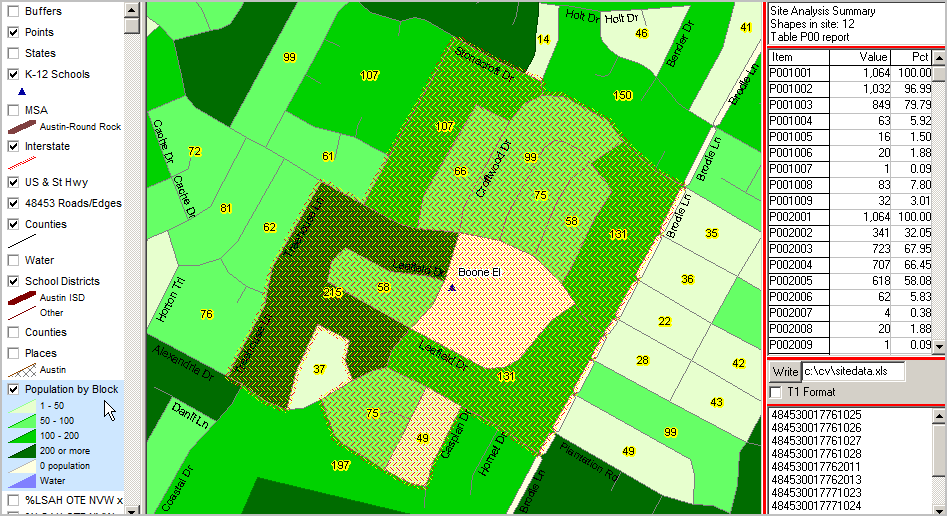
Further zoom-in ... CV Site Analysis operation applied to census block layer; 12 "cherry-picked" blocks in school vicinity. In the graphic below, table in upper right shows 12 blocks (cross-hatched) in this study area.
Aggregate demographics for selected blocks are shown in the mini table below that count: 1,064 total population in this set of blocks (p001001); 849 "White population of one race" (p001003) in this set of blocks. 341 Hispanic (p002002) and 723 non-Hispanic (p002003) Item names shown in left column of profile defined at http://proximityone.com/cen2010_blocks.htm.
List of geocodes for blocks included shown in lower right mini table. By clicking "Write" button, the summary data are written to specified spreadsheet file.
|