McKinney ISD, TX

Contents
Selected CV XE GIS project/application views in Texas.
Click toggle in Table of Contents at left to view sub-state applications.
Integrating shapefiles, ACS demographics, Census 2010 demographics, estimates & projections and related data.
See related interactive ranking tables:
| • | Texas school district demographics: http://proximityone.com/tx_sdc.htm. |
| • | Texas census tract demographics: http://proximityone.com/tracts11dp1.htm. |
| • | Census 2010 demographics: http://proximityone.com/s&o_comparative_profiles.htm |
(all US geography: state, congressional district, county, school district, city/place, metro)
Join the conversation .. ProximityOne on Twitter -- https://twitter.com/ProximityOne
The toggle graphic -- ![]() -- indicates an expanding section. Click the toggle or toggle line to view/close expanding sections.
-- indicates an expanding section. Click the toggle or toggle line to view/close expanding sections.
Compare Waco - Pearland ISD - Texas ACS 2009 3-year estimates -- open this spreadsheet
-- 4 sheet spreadsheet file: demographic, social, economic, housing profiles
The table presented below provides a summary demographic profile for the district based on the Census 2010 P.L. 94-171 data. Similar to a profile developed by Census, this profile also includes two columns providing characteristics for the population under 18 years of age. These profiles are available for any Census 2010 geography, census block and higher level geography.
ProximityOne -- additional details and interactive ranking table
|
||||||||||||||||||||||||||||||||||||||||||||||||||||||||||||||||||||||||||||||||||||||||||||||||||||||||||||||||||||||||||||||||||||||||||||||||||||||||||||||||||||||||||||||||||||||||||||||||||||||||||
General Population and Housing Characteristics: Census 2010
Comparative Analysis based on Demographic Profile Summary File -- http://proximityone.com/cen2010_dpsf.htm (May 2011)
- McKinney city - Collin County - Texas -- http://proximityone.com/cen2010/dp/dpcn10tx16045744.htm
Demographic-Economic Profiles: ACS 2009
Comparative Analysis based on ACS 2009 -- http://proximityone.com/acs.htm
- McKinney ISD - McKinney city - Collin County -- http://proximityone.com/acs/dp09/dpac09tx90029850.htm
Children's Demographics by Type of Enrollment
Age distributions by type of enrollment universe
For more information see ACS 2009 School District Special Tabulation (May 2011)
- McKinney ISD, TX -- http://proximityone.com/sdst/b010014829850.htm
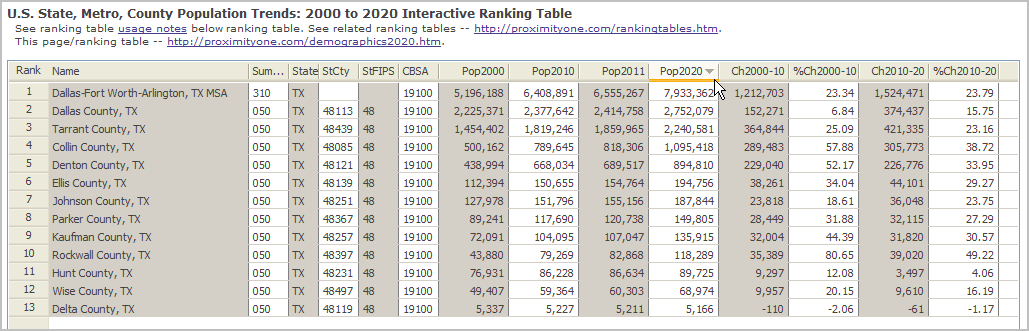
Dallas Metro & County Population Projections to 2020
... Collin County projected to exceed 1 million population by 2020
The following graphic shows the Dallas-Fort Worth-Arlington MSA population projections by county to 2020.
The table is ranked on the projected 2020 total population. Projections reflect Census 2010 results.
See http://proximityone.com/demographics2020.htm to interactively rank on different columns and/or view other areas in the U.S.
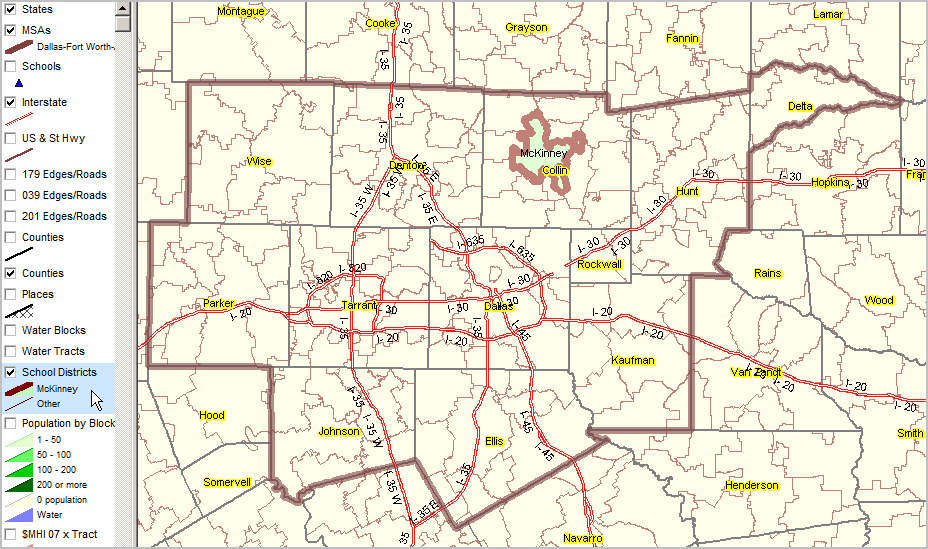
Visual Analysis of Demographic/Economic Characteristics & Patterns
McKinney ISD bold brown boundary green fill pattern in context of Dallas-Fort Worth-Arlington, TX MSA (bold brown semi-transparent boundary)
|
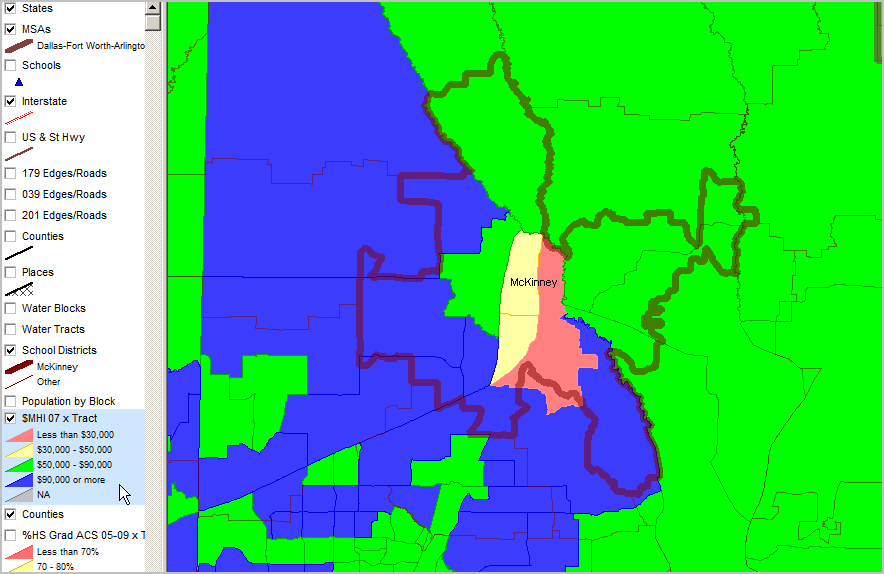
Median Household Income ACS 2005-09 (mid-2007) ... using ACS census tract estimates released December 2010 (http://proximityone.com/acs.htm). See highlighted (blue) layer in legend (left of map) for color/data value interval definitions.
|
Percent high school graduate (population 25 years and over) by school district. Data based on 2009 American Community Survey (http://proximityone.com/acs.htm) 5-year estimates, centric to mid-2007. See highlighted (blue) layer in legend (left of map) for color/data value interval definitions.
|

Percent college graduates (population 25 years and over) by school district. Data based on 2009 American Community Survey (http://proximityone.com/acs.htm) 5-year estimates, centric to mid-2007. See highlighted (blue) layer in legend (left of map) for color/data value interval definitions.
|
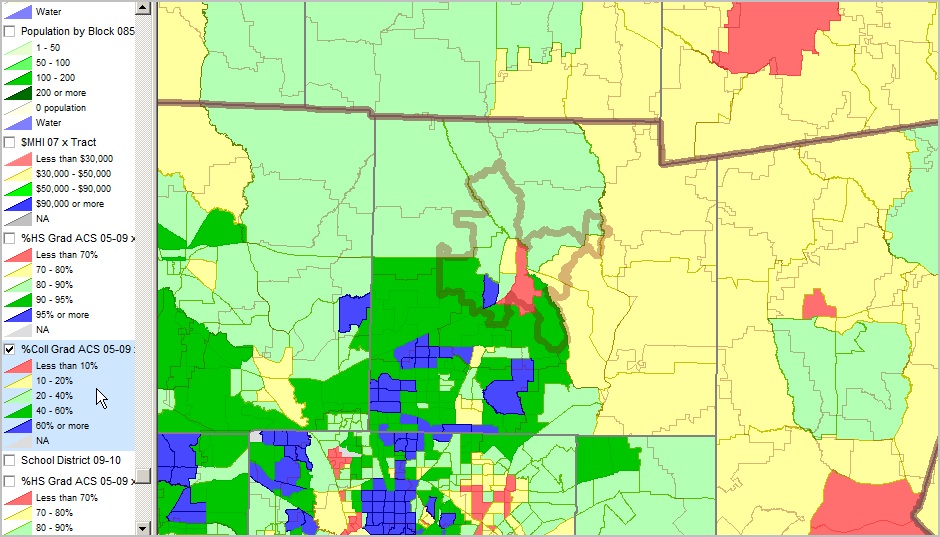
See highlighted (blue) layer in legend (left of map) for color/data value interval definitions. More about these data: http://proximityone.com/cen2010_blocks.htm.
|
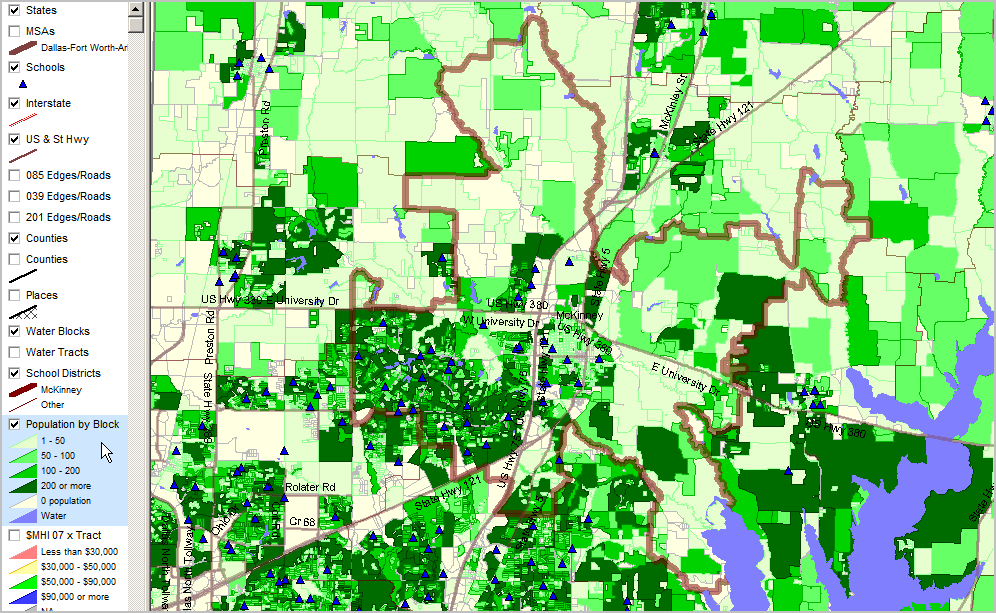
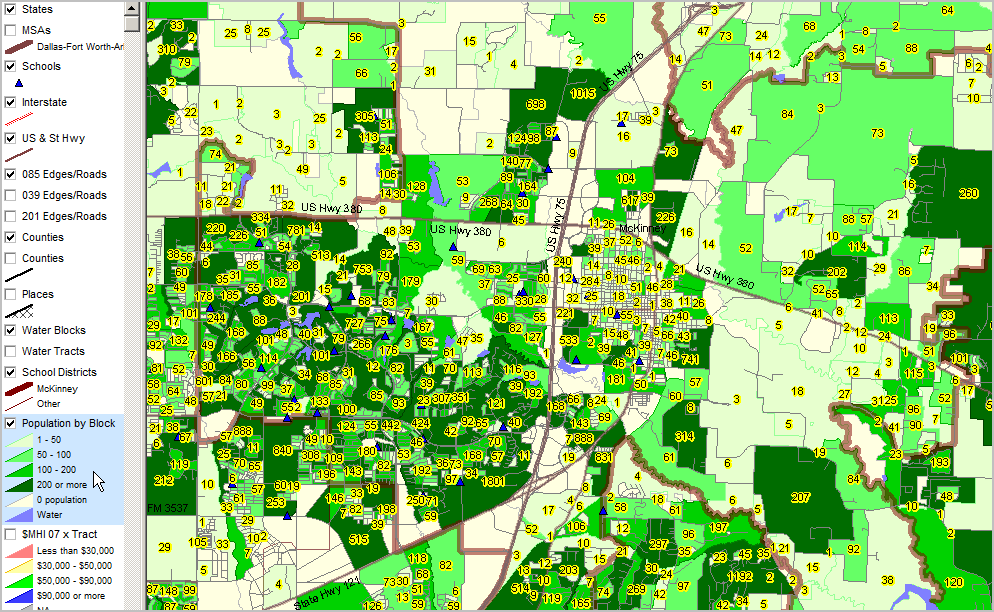
Zoom-in view, similar to above showing total population by block as label. Intersection-to-intersection street detail and K-12 schools shown.
|
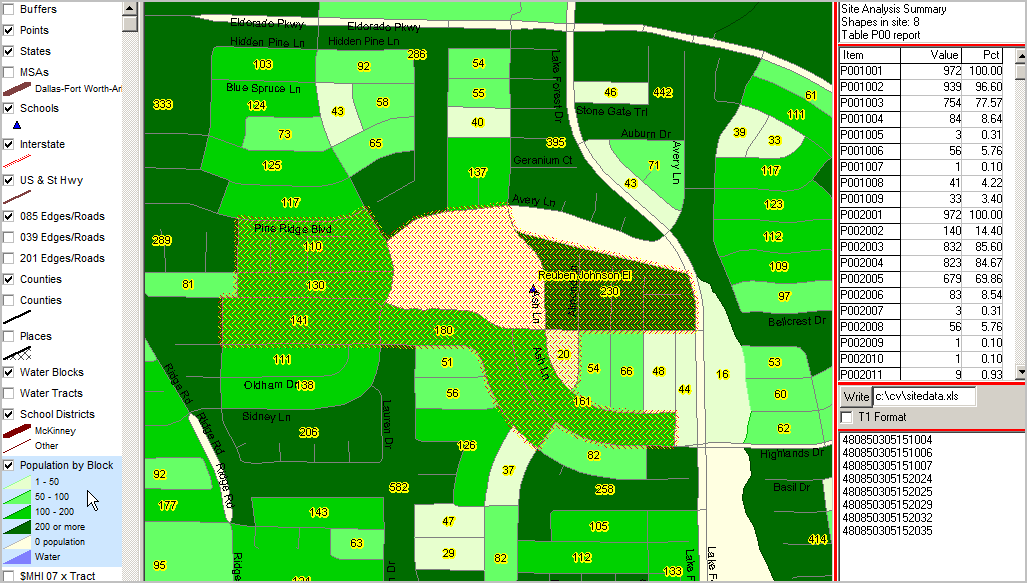
Further zoom-in ... CV Site Analysis operation applied to census block layer; 8 "cherry-picked" blocks near school. In the graphic below, table in upper right shows 8 blocks (cross-hatched) in this study area.
Aggregate demographics for selected blocks are shown in the mini table below that count: 972 total population in this set of blocks (p001001); 754 "White population of one race" (p001003) in this set of blocks. 140 Hispanic (p002002) and 832 non-Hispanic (p002003) Item names shown in left column of profile defined at http://proximityone.com/cen2010_blocks.htm.
List of geocodes for blocks included shown in lower right mini table. By clicking "Write" button, the summary data are written to specified spreadsheet file.
|
Students as markers by school attended.
|
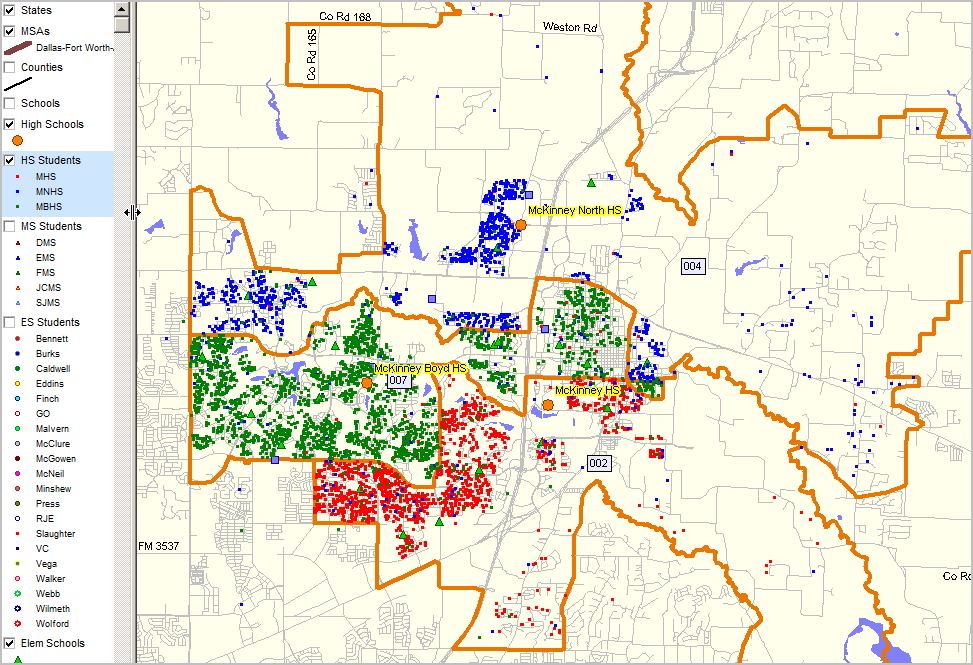
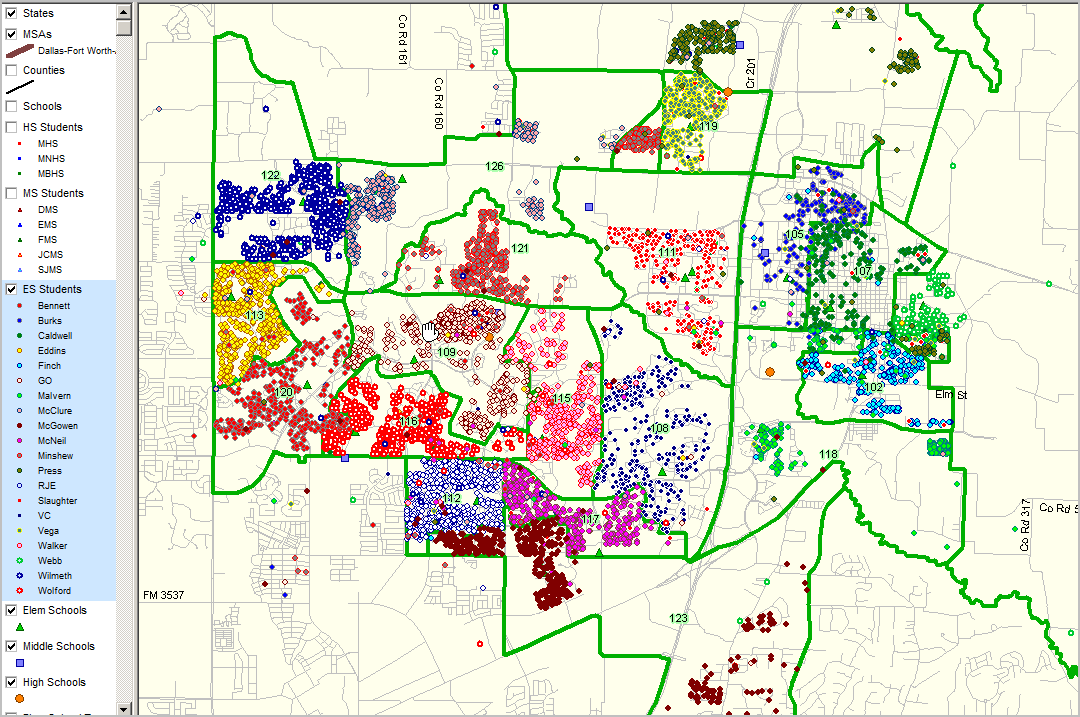
Students as markers by school attended.
|
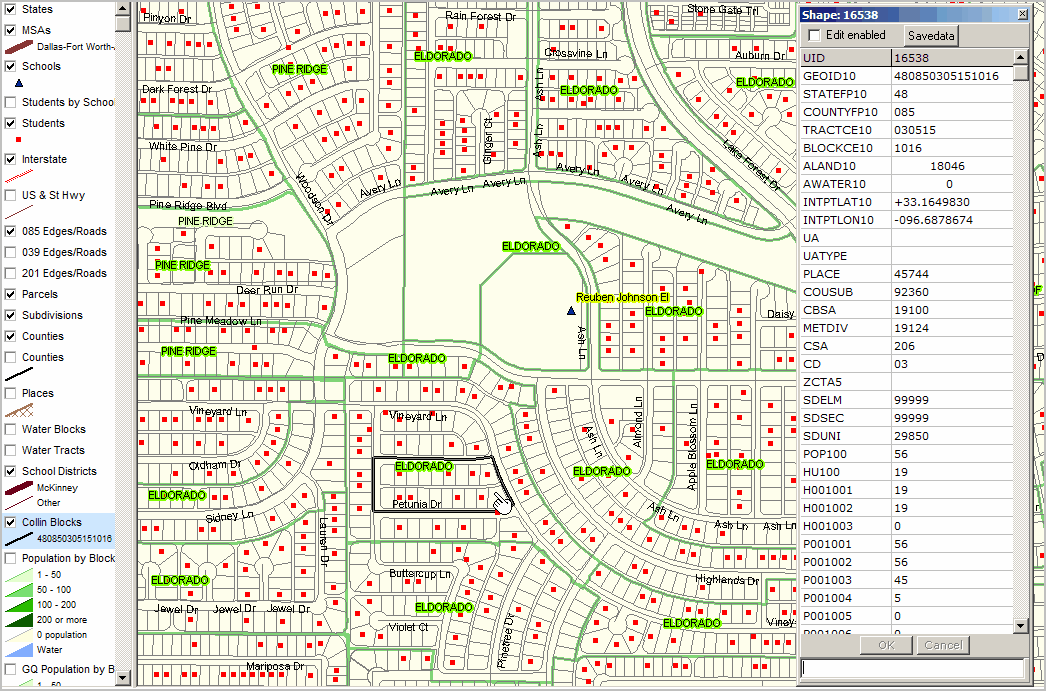
Compare the following view to previous view. Highlighted bold boundary census block in view below (see pointer/hand) is profiled (see table) can be seen in above view (56 population). ... only this one census block is shown through use of query applied to the block layer - see "geoid" in legend at left of map (blue highlighted layer) Following view shows students (red markers), subdivisions (green boundaries/labels), tax parcels (gray boundaries) and streets.
|
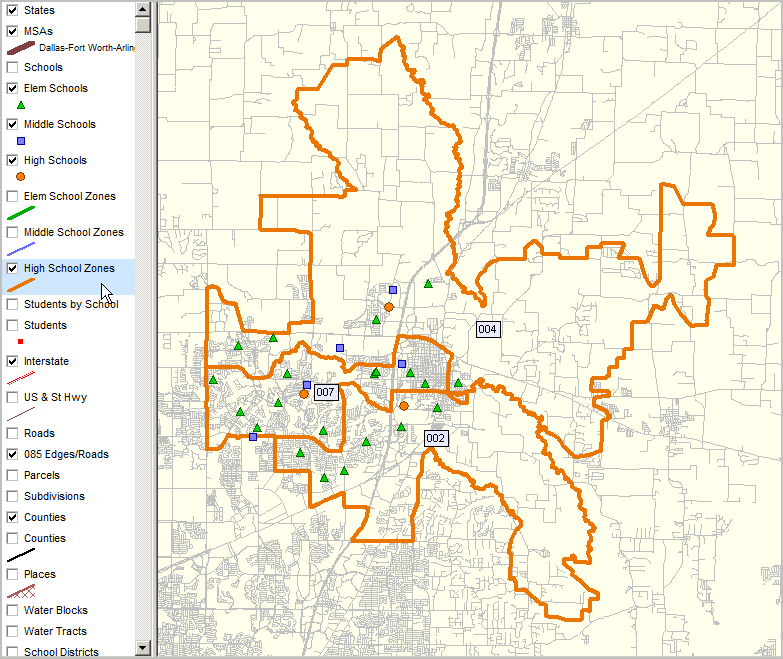
Attendance zone labels show the TEA school code. High schools shown as orange circle markers.
See related interactive Google maps application showing HS zones -- http://proximityone.com/mckinney_hs.htm
|
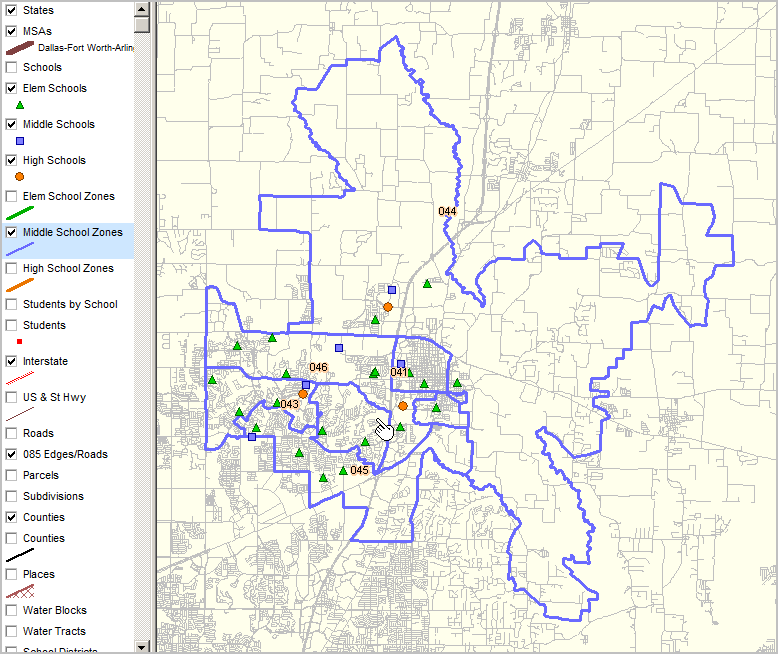
Attendance zone labels show the TEA school code. Middle schools shown as square blue markers. 041 is split into two parts and includes the unlabeled area where pointer located. 043 is split into two parts and includes the unlabeled area to the right of the pointer.
See related interactive Google maps application showing MS zones -- http://proximityone.com/mckinney_ms.htm
|
Dowell, Faubion and Evans are split into two sections.
|

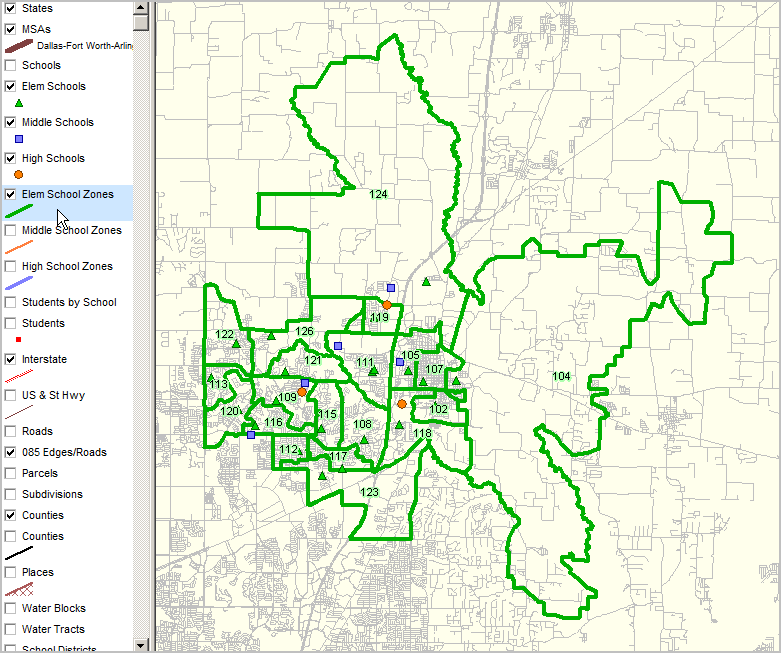
Attendance zone labels show the TEA school code. Elementary schools shown as green triangle markers.
See related interactive Google maps application showing ES zones -- http://proximityone.com/mckinney_es.htm.
|
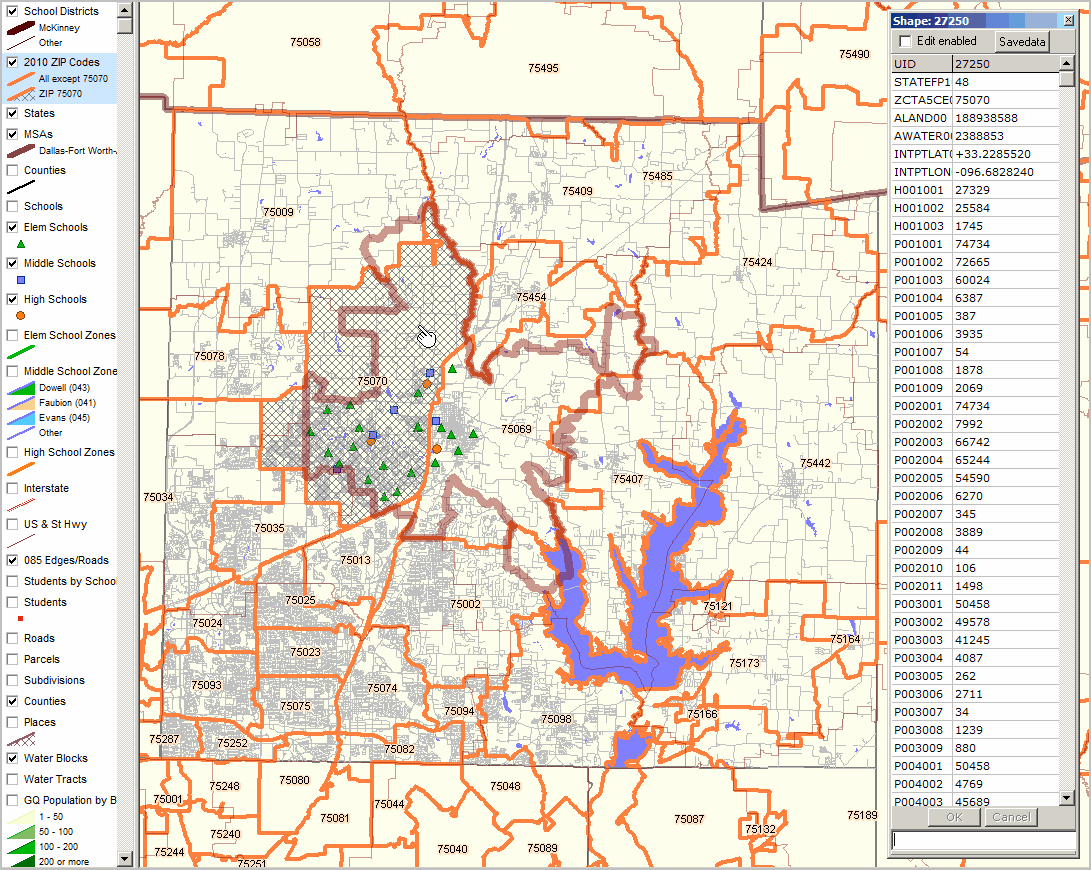
Census 2010 ZIP Code Areas orange boundary with label. McKinney ISD bold brown semi transparent boundary. Identify tool used to show mini-profile of ZIP 75070 (cross-hatched pattern; see pointer). Items in profile described at http://proximityone.com/cen2010_plfile.htm.
|