New York, NY
Selected CommunityViewer project/application views in New York.
Click toggle in Table of Contents at left to view sub-state applications.
Integrating Census 2010 TIGER Shapefiles, ACS 2009 5-year demographics, Census 2010 demographics and related data
See related interactive ranking tables:
| • | New York school district demographics: http://proximityone.com/sd_ny.htm. |
| • | New York census tract demographics: http://proximityone.com/ustr0509_ny.htm. |
| • | Census 2010 demographics: http://proximityone.com/cen2010_pl94171.htm |
(all US geography: state, congressional district, county, school district, city/place, metro)
Children's Demographics by Type of Enrollment
Age distributions by type of enrollment universe
Data centric to mid-2007 are based on the ACS 2009 School District Special Tabulation released May 2011
- New York City Public Schools, NY -- http://proximityone.com/sdst/b010013620580.htm
New York Metro & County Population Projections to 2020
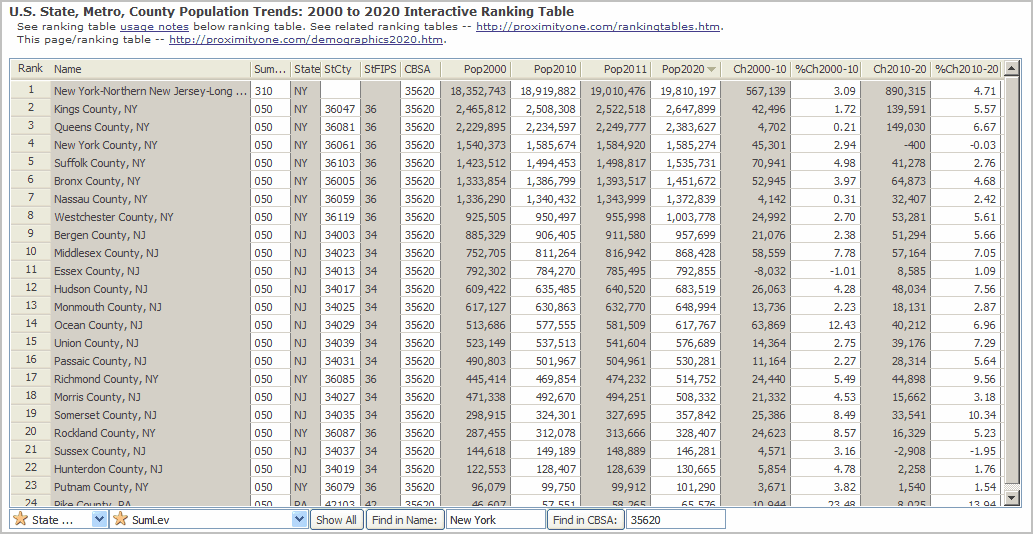
The following graphic shows the New York-Northern New Jersey-Long Island, NY-NJ-PA MSA (CBSA 35620) population projections by county to 2020.
The table is ranked on the projected 2020 total population (Pop2020). Projections reflect Census 2010 results.
See http://proximityone.com/demographics2020.htm to interactively rank on different columns and/or view other areas in the U.S.
Visual Analysis of Demographic/Economic Characteristics & Patterns
|
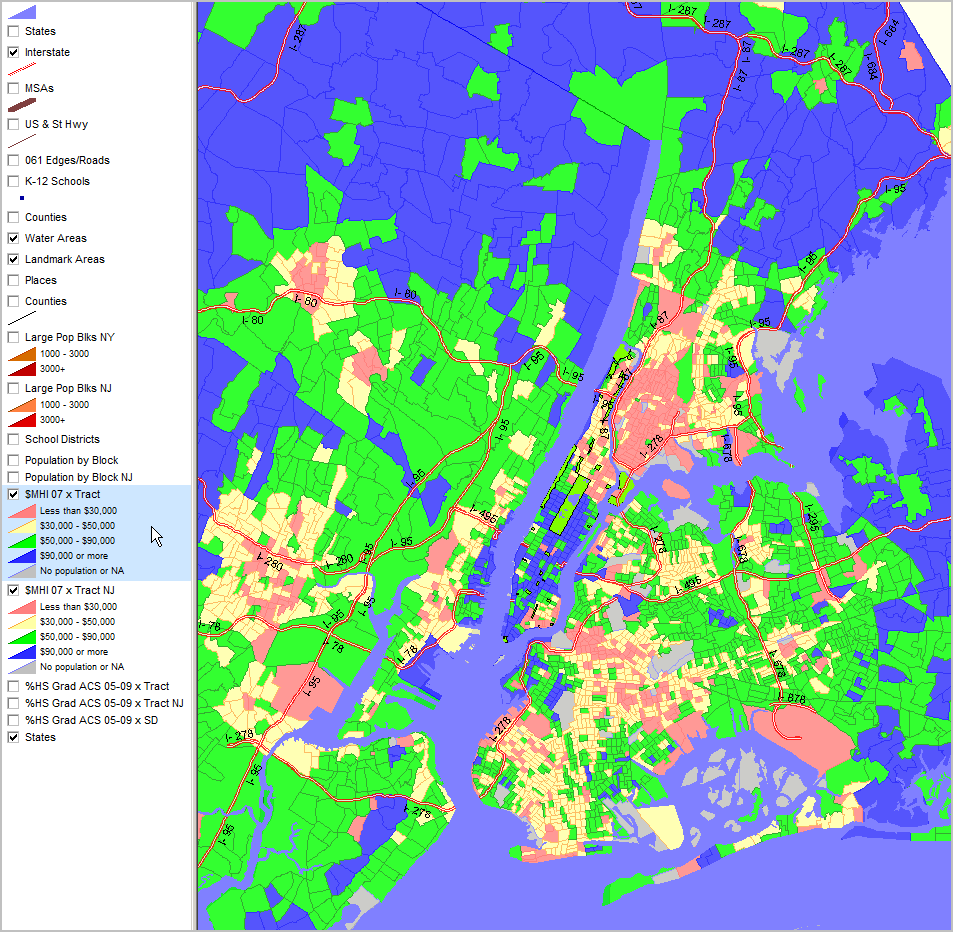
Median household income ($MHI) by census tract. Data based on 2009 American Community Survey (http://proximityone.com/acs.htm) 5-year estimates, centric to mid-2007. See $MHI color patterns in highlighted layer in legend at left of map view.
|
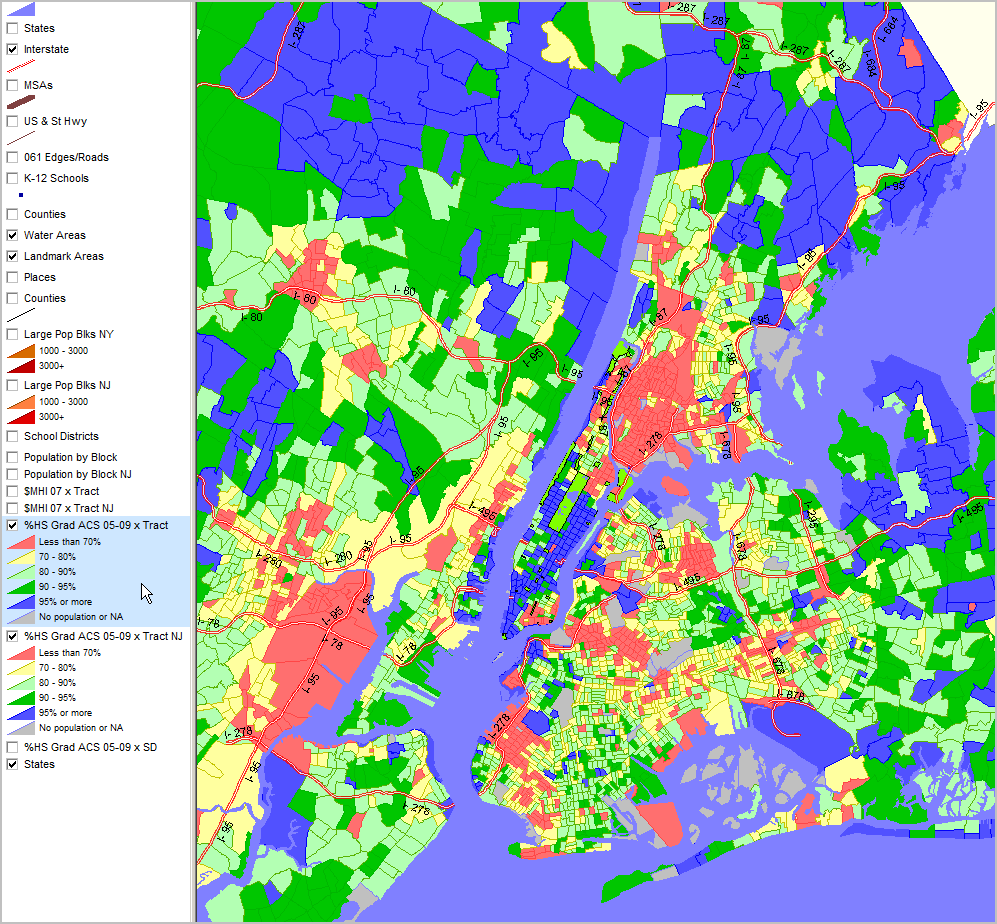
Percent high school graduate (population 25 years and over) by census tract. Data based on 2009 American Community Survey (http://proximityone.com/acs.htm) 5-year estimates, centric to mid-2007. See color patterns in highlighted layer in legend at left of map view.
|
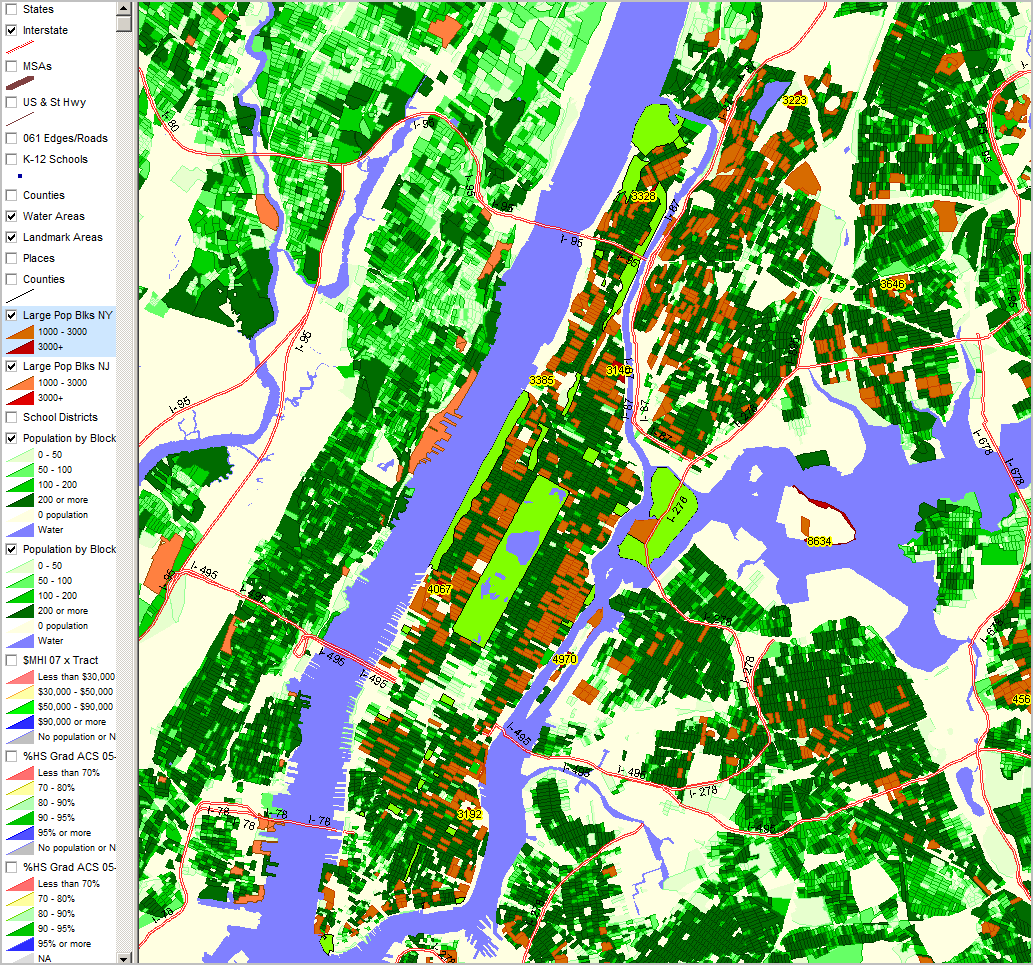
See highlighted (blue) layer in legend (left of map) for color/data value interval definitions. More about these data: http://proximityone.com/cen2010_blocks.htm.
|
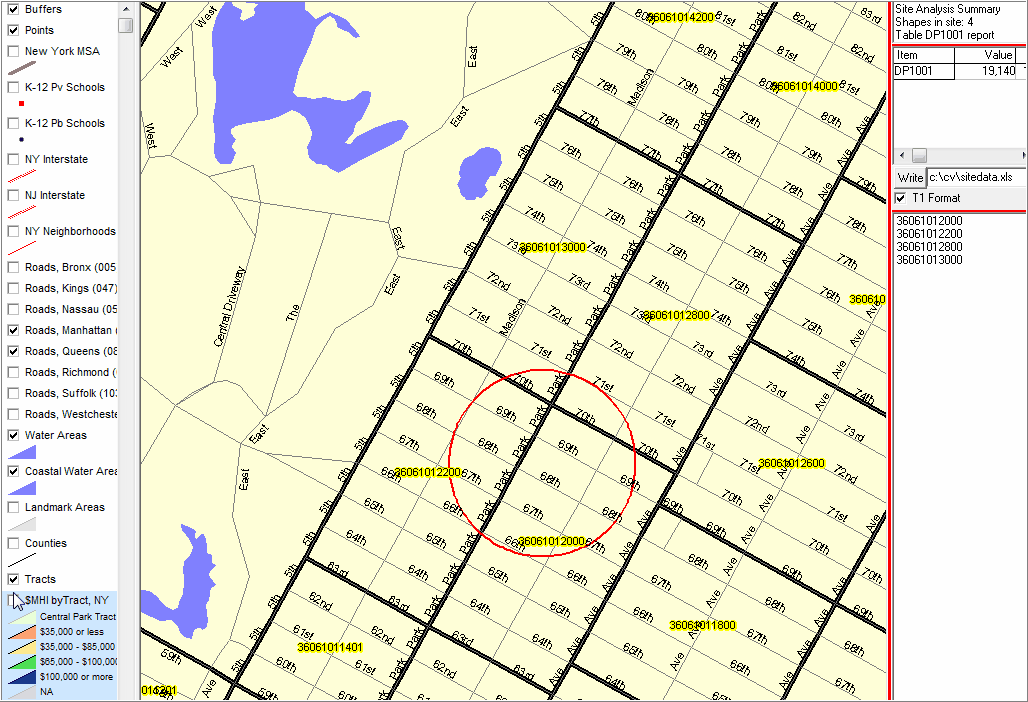
Zoom-in view with thematic pattern off; showing tract geocodes.
|
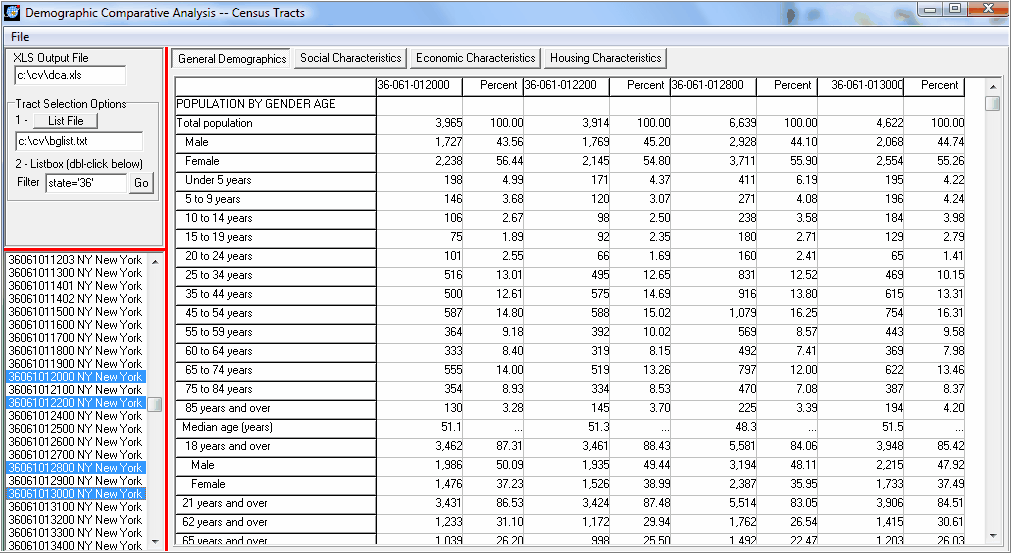
Previous site analysis tracts auto selected; then the Demographic Comparative Analysis is used to display demographic profiles for each tract and composite 4 tract area.
|
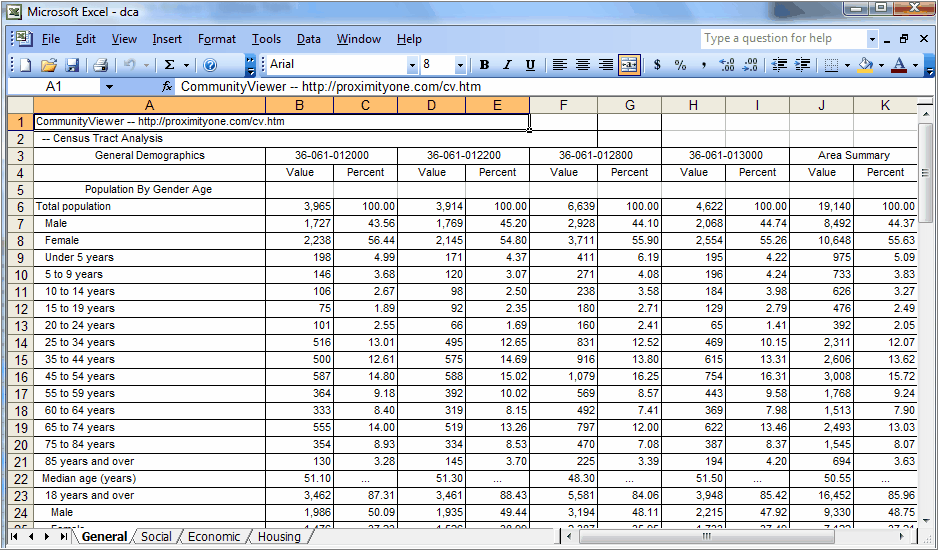
4-worksheet demographic profile; rightmost columns show composite for 4 tracts. Process can be repeated for any set of tracts. See scope of demographics at http://proximityone.com/dp1.htm. Authorized users (contact Proximity - add note in text section) may access this 4-worksheet Excel file.
|
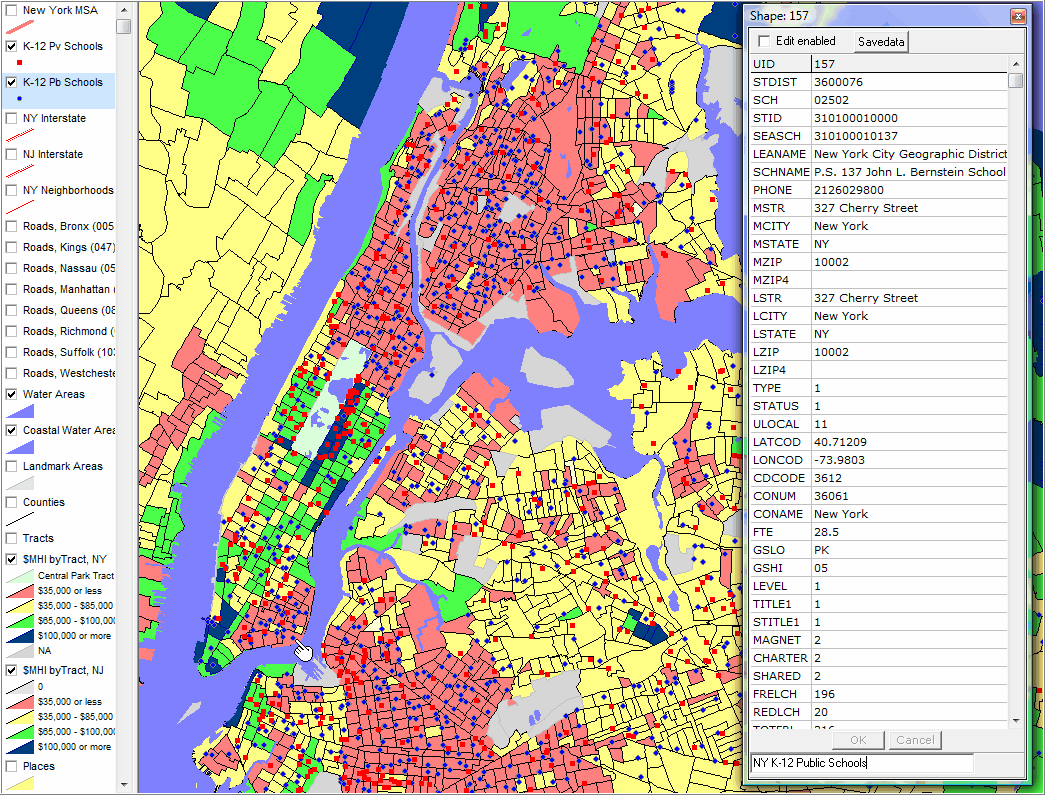
Blue and red markers show New York public and private schools in context median household income by census tract. Illustrates use of CV identify tool to show [partial] profile of a selected school. See pointer in lower Manhattan. Add your own data; view in context with these or other data.
|

