|
|
|
Language Use Patterns
The changing landscape of speakers of non-English languages in the United States is already having a significant impact on wide-ranging social, educational, budgetary and other issues. The ranking table presented below shows attributes of language use by state based on the American Community Survey 2007. See notes below table describing the column headers. Population Speaking Language other than English at Home Ranking Table Click column header to sort; click again to sort other direction. See related Ranking Tables Main Page. Column headers: 2 -- Pop 5Yrs+ -- Population 5 years and older 3 -- LSAH OTE -- Item 2 who spoke a language other than English at home 4 -- %LSAH OTE -- Item 3 as percent of item 2 (percent who spoke a language other than English at home) English Speaking (ES) Ability 5 -- ES Very Well -- Speak English Very Well 6 -- ES Well -- Speak English Well 7 -- ES Not Well -- Speak English Not Well 8 -- ES None -- Speak English Not at all Visual Analysis, Mapping & GIS Applications -- Patterns of Percent Population Speaking Language at Home Other than English by State The thematic map presented below shows patterns of percentage of the population who spoke a language other than English at home by state in 2007. The CommunityViewer (CV) identify tool (see pointer) is used to click on an area to display a mini-profile. The mini-profile shows that same data for the state (California) as shown in the ranking table. 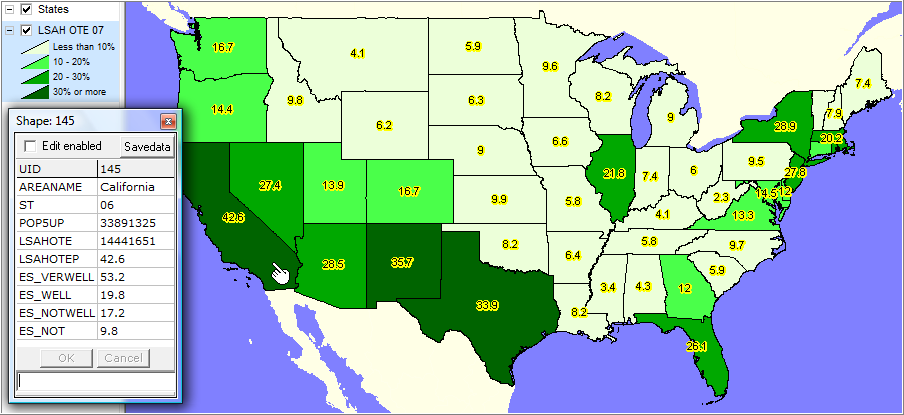
Extended Subject Matter, More Recent Data, Drill Down Geography Data on "Language Spoken at Home" are collected and tabulated annually in the Census Bureau American Community Survey (ACS) program. ACS 2009 data will be released in late 2010. Unlike Census 2000, there are no data to be tabulated from Census 2010 on language use. More about ACS. More about Census 2010 and ACS. The following table illustrates the nature of additional language use subject matter available from the ACS. This table is a part of the social characteristics section of the ACS demographic profiles. The ACS demographic profiles may be accessed using the no cost DMIGateway web-based resources and the Census Bureau FactFinder. Data illustrated in the table are available for all places, counties, metros, school districts and higher level geography with population 20,000 or more. The type of comparative analysis shown in the table (comparing multiple areas in a side by side manner) can only be displayed using the ProximityOne GeoDemographic Information System. See related additional information about the GDIS Comparative Analysis Demographic Profiles.
Additional Information Proximity develops geodemographic/economic data and analytical tools. We help organizations knit together and use diverse data in a decision-making and analytical framework. We develop custom demographic/economic estimates and projections, develop geographic and geocoded address files, and assist with impact and geospatial analyses. Wide-ranging organizations use our tools (software, data, methodologies) to analyze their own data integrated with other data. Contact Proximity (888-364-7656) with questions about data covered in this section or to discuss custom estimates, projections or analyses for your areas of interest. | |||||||||||||||||||||||||||||||||||||||||||||||||||||||||||||||||||||
|
|