| MARITAL STATUS | |
| Population 15 years and over | DP2017 |
| Never married | DP2018 |
| Now married, except separated | DP2019 |
| Separated | DP2020 |
| Widowed | DP2021 |
| Female | DP2022 |
| Divorced | DP2023 |
| Female | DP2024 |
| GRANDPARENTS AS CAREGIVERS | |
| Grandparent living in household with one or more own grandchildren under 18 years | DP2025 |
| Grandparent responsible for grandchildren | DP2026 |
| VETERAN STATUS | |
| Civilian population 18 years and over | DP2027 |
| Civilian veterans | DP2028 |
|
| DISABILITY STATUS OF THE CIVILIAN NONINSTITUTIONALIZED POPULATION | |
| Population 5 to 20 years | DP2029 |
| With a disability | DP2030 |
| Population 21 to 64 years | DP2031 |
| With a disability | DP2032 |
| Percent employed (1 expressed decimal) | DP2033 |
| No disability | DP2034 |
| Percent employed (1 expressed decimal) | DP2035 |
| Population 65 years and over | DP2036 |
| With a disability | DP2037 |
|
| RESIDENCE 5 YEARS EARLIER | |
| Population 5 years and over | DP2038 |
| Same house 5 years earlier | DP2039 |
| Different house in the U.S. 5 years earlier | DP2040 |
| Same county | DP2041 |
| Different county | DP2042 |
| Same state | DP2043 |
| Different state | DP2044 |
| Elsewhere 5 years earlier | DP2045 |
|
| NATIVITY AND PLACE OF BIRTH | |
| Total population | DP2046 |
| Native | DP2047 |
| Born in United States | DP2048 |
| State of residence | DP2049 |
| Different state | DP2050 |
| Born outside United States | DP2051 |
| Foreign born | DP2052 |
| Entered 1990 to March 2000 | DP2053 |
| Naturalized citizen | DP2054 |
| Not a citizen | DP2055 |
| REGION OF BIRTH OF FOREIGN BORN | |
| Total (excluding born at sea) | DP2056 |
| Europe | DP2057 |
| Asia | DP2058 |
| Africa | DP2059 |
| Oceania | DP2060 |
| Latin America | DP2061 |
| Northern America | DP2062 |
|
| Population 5 years and over | DP2063 |
| English only | DP2064 |
| Language other than English | DP2065 |
| Speak English less than "very well" | DP2066 |
| Spanish | DP2067 |
| Speak English less than "very well" | DP2068 |
| Other Indo-European languages | DP2069 |
| Speak English less than "very well" | DP2070 |
| Asian and Pacific Island languages | DP2071 |
| Speak English less than "very well" | DP2072 |
|
| EMPLOYMENT STATUS | |
| Population 16 years and over | DP3001 |
| In labor force | DP3002 |
| Civilian labor force | DP3003 |
| Employed | DP3004 |
| Unemployed | DP3005 |
| Percent of civilian labor force (1 decimal) | DP3006 |
| Armed Forces | DP3007 |
| Not in labor force | DP3008 |
| OCCUPATION | |
| Management, professional, and related occupations | DP3024 |
| Service occupations | DP3025 |
| Sales and office occupations | DP3026 |
| Farming, fishing, and forestry occupations | DP3027 |
| Construction, extraction, and maintenance occupations | DP3028 |
| Production, transportation, and material moving occupations | DP3029 |
| INDUSTRY | |
| Agriculture, forestry, fishing and hunting, and mining | DP3030 |
| Construction | DP3031 |
| Manufacturing | DP3032 |
| Wholesale trade | DP3033 |
| Retail trade | DP3034 |
| Transportation and warehousing,and utilities | DP3035 |
| Information | DP3036 |
| Finance, insurance, real estate, and rental and leasing | DP3037 |
| Professional, scientific, management, administrative, and waste management services | DP3038 |
| Educational, health and social services | DP3039 |
| Arts, entertainment, recreation, accommodation and food services | DP3040 |
| Other services (except public administration) | DP3041 |
| Public administration | DP3042 |
| CLASS OF WORKER | |
| Private wage and salary workers | DP3043 |
| Government workers | DP3044 |
| Self-employed workers in own not incorporated business | DP3045 |
| Unpaid family worker | DP3046 |
|
| INCOME IN PREVIOUS YEAR | |
| Households | DP3047 |
| Less than $10,000 | DP3048 |
| $10,000 to $14,999 | DP3049 |
| $15,000 to $24,999 | DP3050 |
| $25,000 to $34,999 | DP3051 |
| $35,000 to $49,999 | DP3052 |
| $50,000 to $74,999 | DP3053 |
| $75,000 to $99,999 | DP3054 |
| $100,000 to $149,999 | DP3055 |
| $150,000 to $199,999 | DP3056 |
| $200,000 or more | DP3057 |
| Median household income (dollars) | DP3058 |
| Families | DP3069 |
| Median family income (dollars) | DP3080 |
| Per capita income (dollars) | DP3081 |
|
| NUMBER BELOW POVERTY LEVEL IN PREVIOUS YEAR | |
| Families | DP3084 |
| Individuals | DP3090 |
| 18 years and over | DP3091 |
| 65 years and over | DP3092 |
| NUMBER FOR WHOM POVERTY STATUS IS DETERMINED IN PREVIOUS YEAR | |
| Families | DP3096 |
| Individuals | DP3102 |
| 18 years and over | DP3103 |
| 65 years and over | DP3104 |
|
| HOUSING OCCUPANCY | |
| Total housing units | DP1086 |
| Occupied housing units | DP1087 |
| Vacant housing units | DP1088 |
| For seasonal,recreational,or occasional use | DP1089 |
| Homeowner vacancy rate (percent) | DP1090 |
| Rental vacancy rate (percent) | DP1091 |
| HOUSING TENURE | |
| Occupied housing units | DP1092 |
| Owner-occupied housing units | DP1093 |
| Renter-occupied housing units | DP1094 |
| Average household size of owner-occupied units | DP1095 |
| Average household size of renter-occupied units | DP1096 |
| UNITS IN STRUCTURE | |
| 1 unit, detached | DP4002 |
| 1 unit, attached | DP4003 |
| 2 units | DP4004 |
| 3 or 4 units | DP4005 |
| 5 to 9 units | DP4006 |
| 10 to 19 units | DP4007 |
| 20 or more units | DP4008 |
| Mobile home | DP4009 |
| Boat, RV, van, etc. | DP4010 |
| YEAR STRUCTURE BUILT | |
| 1999 to March 2000 | DP4011 |
| 1995 to 1998 | DP4012 |
| 1990 to 1994 | DP4013 |
| 1980 to 1989 | DP4014 |
| 1970 to 1979 | DP4015 |
| 1960 to 1969 | DP4016 |
| 1940 to 1959 | DP4017 |
| 1939 or earlier | DP4018 |
| OCCUPANTS PER ROOM | |
| 1.00 or less | DP4053 |
| 1.01 to 1.50 | DP4054 |
| 1.51 or more | DP4055 |
|
| OWNER OCCUPIED UNITS BY VALUE | DP4056 |
| Less than $50,000 | DP4057 |
| $50,000 to $99,999 | DP4058 |
| $100,000 to $149,999 | DP4059 |
| $150,000 to $199,999 | DP4060 |
| $200,000 to $299,999 | DP4061 |
| $300,000 to $499,999 | DP4062 |
| $500,000 to $999,999 | DP4063 |
| $1,000,000 or more | DP4064 |
| Median (dollars) | DP4065 |
|
3 - Using CV GIS with state by tract geodemographic shapefiles
To use the zoom tool to zoom-in,
| • | select the zoom tool from the tool bar, |
| • | left-click on the point on the map that you want as the upper left corner of the zoom-in view, |
| • | hold mouse key down and drag to position in map view that you want as the lower right corner of the zoom-in view, |
| • | release the mouse button. |
The zoom-in view appears. Reverse the process to zoom out. Refer to user guide for additional information.
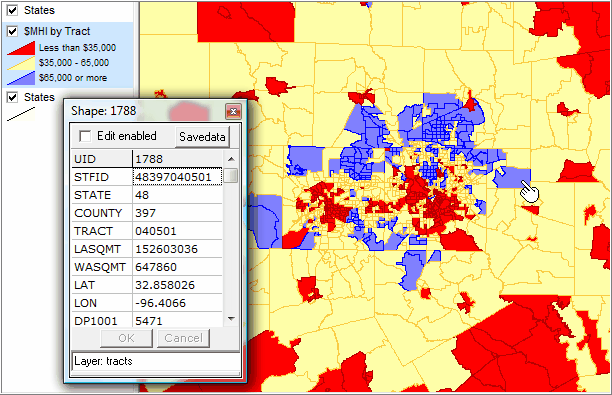
Also illustrates use of identify tool to display mini-profile for selected tract (see pointer)
|
The Add Layer button is used to create another instance of the state by tract boundary file.
The Layer Editor is used to select different subject matter.
The resulting thematic map shows population density by census tract.
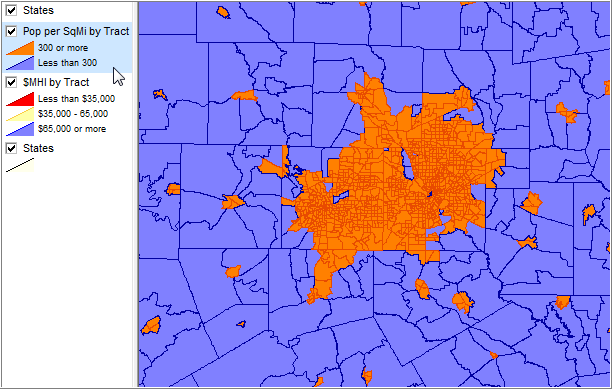
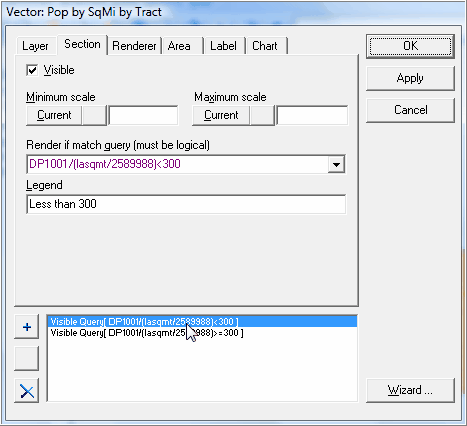
To develop the above view, the rendering query is set for two sections/intervals in the Layer Editor -- graphic below.
The query DP1001/(lasqmt/2589988)<300 is used to display tracts meeting this criteria light blue.
DP1001 is total population; lasqmt is land area in square meters; the constant adjusts square meters to square miles.
|
The Texas statewide all public schools shapefile is included in the project setup file (CVInstaller described in Step 1). The shapefile is named schools2008_tea.shp sourced from the Texas Education Agency. This shapefile is included so that you can see how add and use your own point/marker shapefile.
Field names and selected field value descriptions
OBJECTID LongInt[ 9] -- geographic object id, ignore
DISTRICT String[ 6] -- Texas state school district code
DISTNAME String[ 42] -- Texas state school district name
CAMPUS String[ 10] -- Texas state school/campus code
CAMPNAME String[ 42] -- Texas state school/campus code
STREET_MAI String[ 50] -- School mailing street address
CITY_MAIL String[ 50] -- School mailing city
ZIP_MAIL String[ 10] -- School mailing zip code
STREET String[ 50] -- School street address
CITY String[ 25] -- School city
ZIP String[ 10] -- School zip code
COUNTY String[ 3] -- School county code
CNTYNAME String[ 25] -- School county name
REGION String[ 2] -- School education service area code
01 REGION I EDINBURG
02 REGION II CORPUS CHRISTI
03 REGION III VICTORIA
04 REGION IV HOUSTON
05 REGION V BEAUMONT
06 REGION VI HUNTSVILLE
07 REGION VII KILGORE
08 REGION VIII MT PLEASANT
09 REGION IX WICHITA FALLS
10 REGION X RICHARDSON
11 REGION XI FORT WORTH
12 REGION XII WACO
13 REGION XIII AUSTIN
14 REGION XIV ABILENE
15 REGION XV SAN ANGELO
16 REGION XVI AMARILLO
17 REGION XVII LUBBOCK
18 REGION XVIII MIDLAND
19 REGION XIX EL PASO
20 REGION XX SAN ANTONIO
GRADERANGE String[ 50] -- School grade range
grade list format, examples:
PK KG 01 02 03 04 05 06 07 08 09 10 11 12
09 10 11 12
09 10 11 12
09 10
PK KG 01 02 03 04 05
GRADEGRP String[ 1] -- School grade group/type
1 elementary
2 middle school
3 junior high school
4 high school
5 elementary/secondary
6 other (does not fit into above classifications)
7 unclassified
VERIFY String[ 1] -- School location verification
0 location has not been checked
1 location checked (aerial photography, etc)
placed on map, position not checked
INSTR_TYPE String[ 30] -- Text description of teaching institution type
STREET_M_1 String[ 50] -- Supplemental street text
|
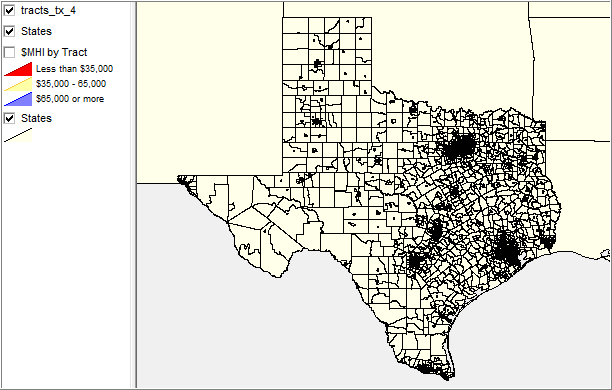
Use the Add Layer toolbar button to add another instance of the state by tracts shapefile to the project. Add the shapefile c:\cv\tracts\tracts_tx.shp. Uncheck the $MHI by Tract layer. The view now appears as shown below.
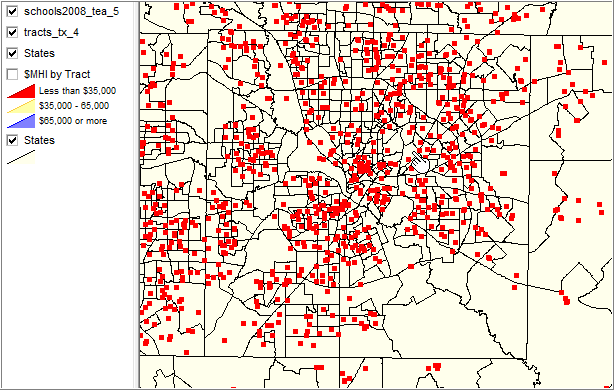
Use the Add Layer toolbar button to add the schools shapefile to the project. Add the shapefile c:\cv\tracts\schools2008_tea.shp. The view now appears as shown below.
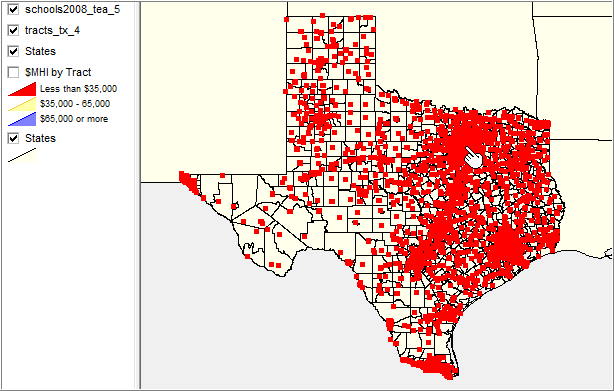
Use the zoom tool to zoom in to the Dallas area (see pointer in above view)
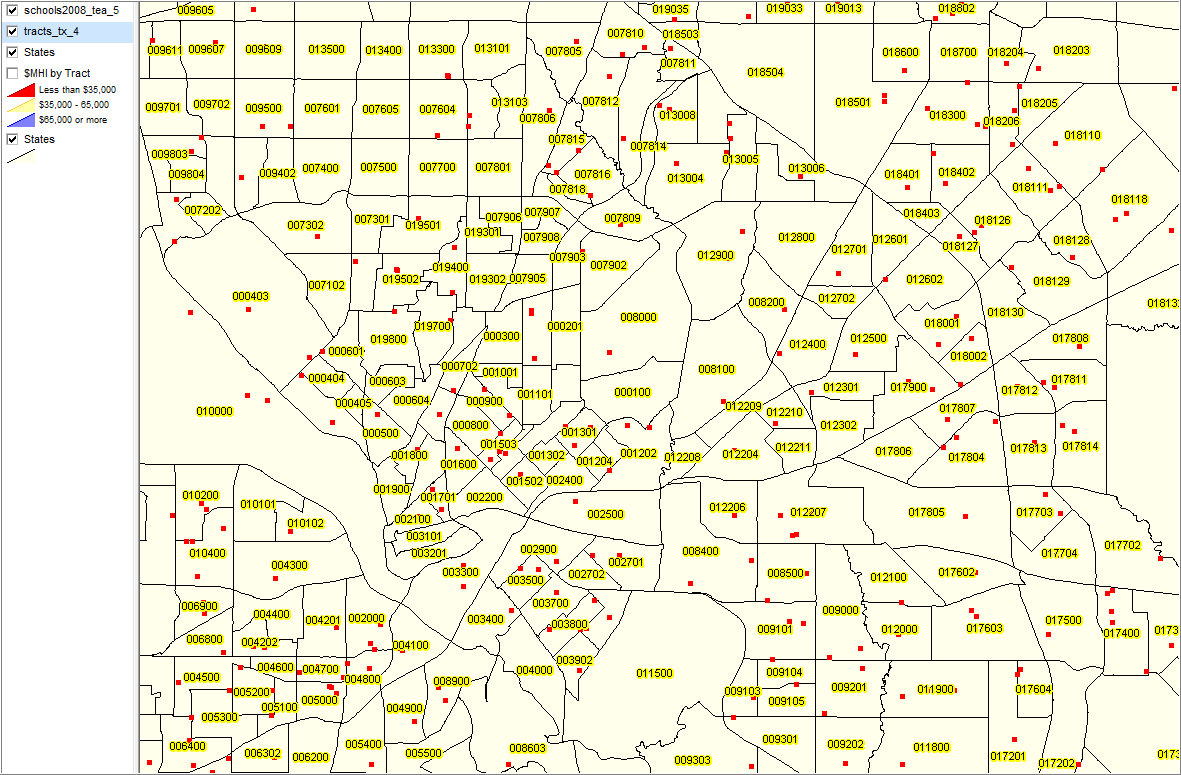
The above view is centered in Dallas County ('square-ish' boundary). Zoom further to the pointer in the above view and expand the overall window. dbl-click on the new tracts layer in the legend panel starting the Layer Editor. Use the Label tab to add the TRACT field as the label; select the position as centered. The view appears as shown below.
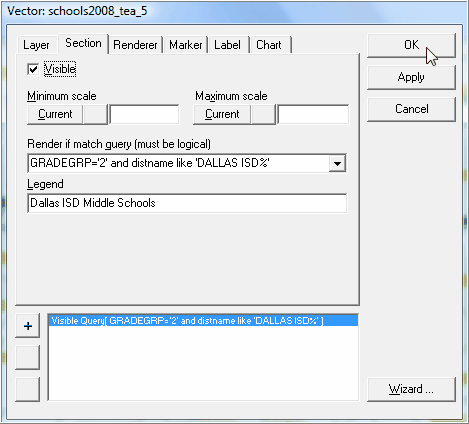
Suppose you only want to view middle schools. Dbl-click the schools layer in the legend panel starting the Layer Editor.
Use the Section tab and set the query to GRADEGRP='2' and distname like 'DALLAS ISD%' (Dallas ISD Middle Schools) as shown below.
Click the Label tab and select campname (campus name) as the label. Click OK.
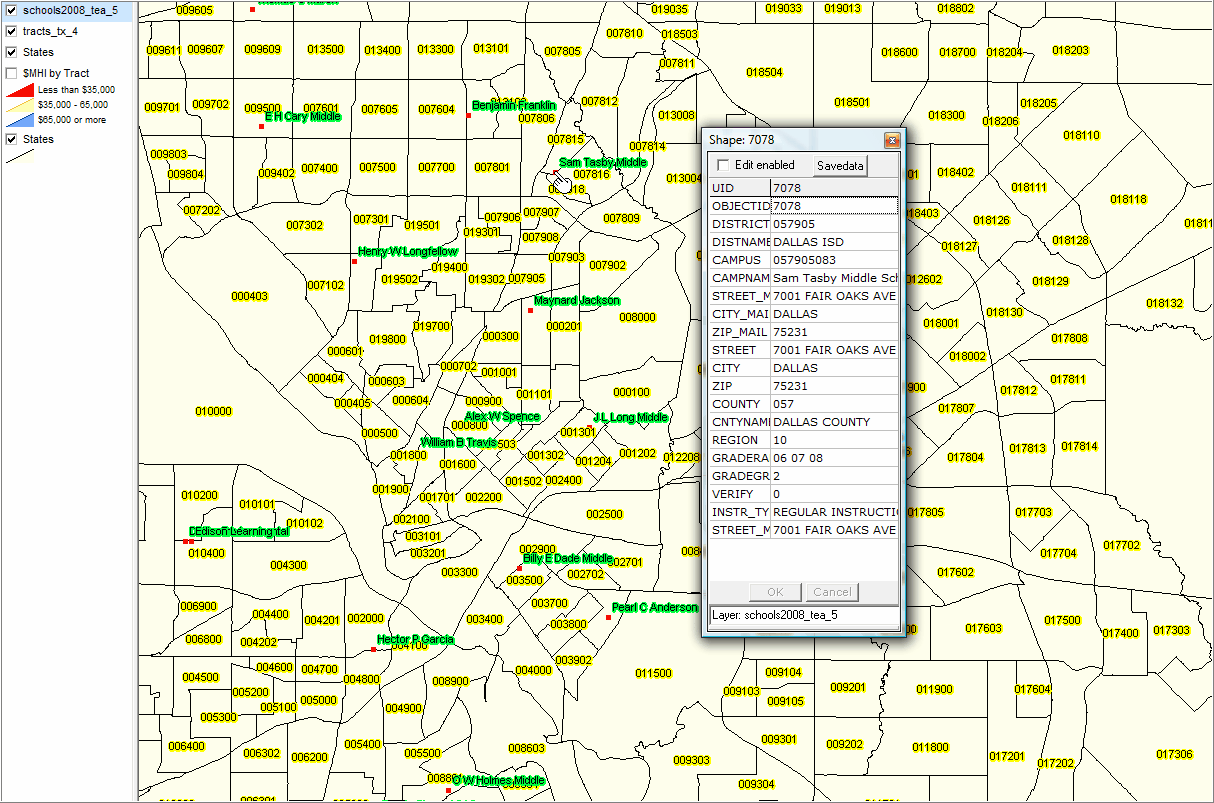
The following view appears. This process illustrates how to select all schools of a given type in a particular school district. The identify tool (see pointer) is used to profile one school.
|
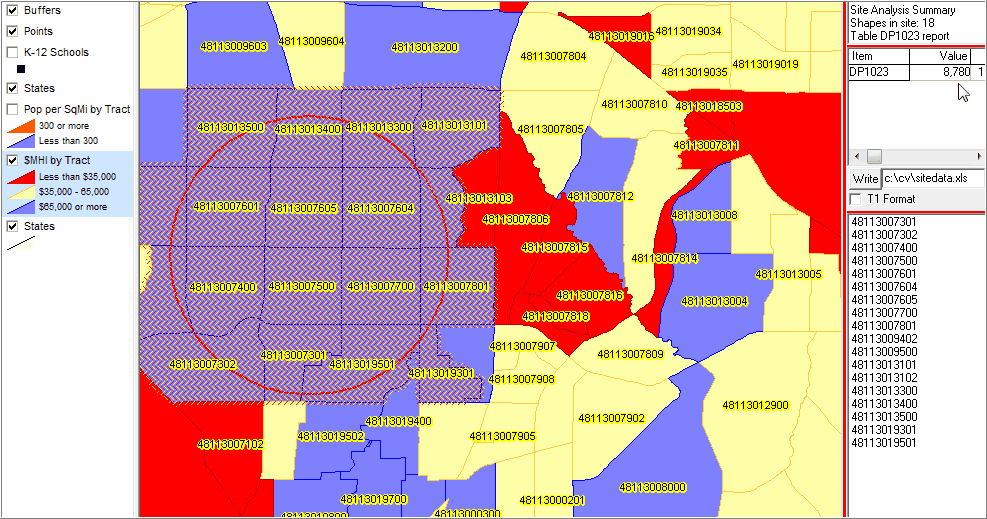
Selected higher income tracts are selected for a study area. The item DP1023 (Population 65 years and over) is selected as subject matter. There are 8,780 people 65 years and over in the selected 18 tracts (see upper right section in next graphic by pointer). Tract codes are listed in the lower right section.
|
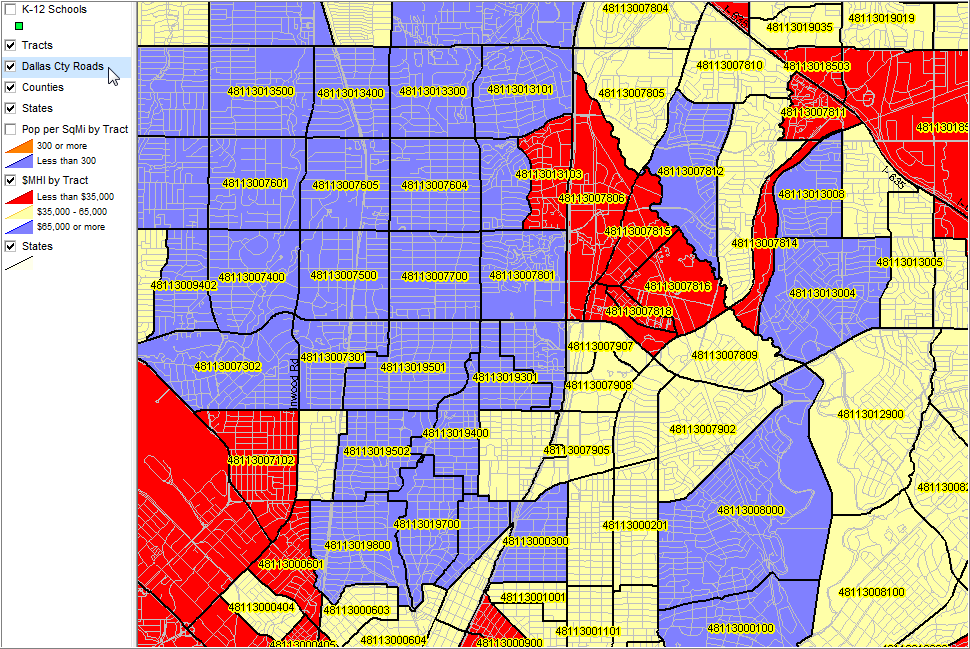
To add roads for a county, using Texas and Dallas County as an example, use a Web browser and connect to http://www2.census.gov/cgi-bin/shapefiles/county-files?county=48113 (state 48 county 113). Dbl-click "All lines" and expand that set of files to c:\cv\tracts. Use the CV Add Layer button to add the all lines shapefile to the project (C:\cv\tracts\tl_2008_48113_edges.shp). To view just roads (not all lines), dbl-click the new all lines layer name in the legend panel. In the Layer Editor panel, click the Section tab. In the Render if edit box, key the text: ROADFLG='Y' and click OK. The roads now appear.
|
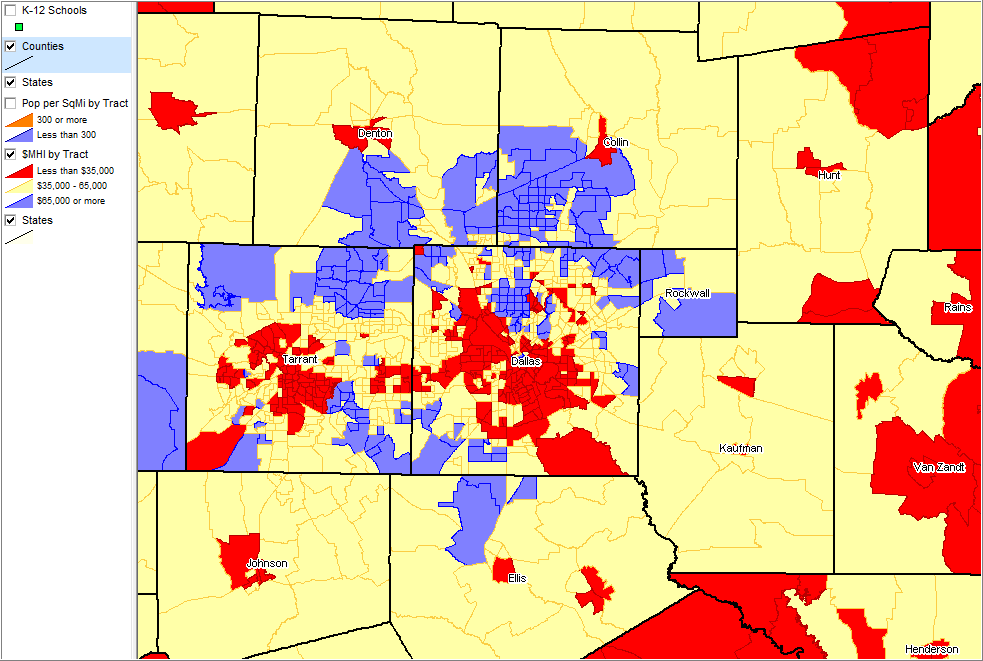
To add counties, using Texas as an example, use a Web browser and connect to http://www2.census.gov/cgi-bin/shapefiles/state-files?state=48 (state 48) and dbl-click "Current County and Equivalent". Expand all files in that zip file to c:\cv\tracts. The following example shows the county boundaries and counties labeled with name.
|
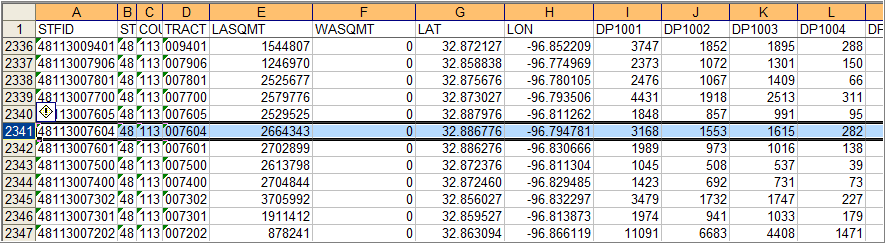
Tract 007604 (highlighted) is shown in the map view for site analysis and other tract labeled graphics above.
|
For more information on accessing the broader data in Proximity databases or acquiring the map files, contact Proximity.
Page url:
http://proximityone.com/tracts/guide/index.htm?census_tract_geodemographic_shapefiles.htm
|


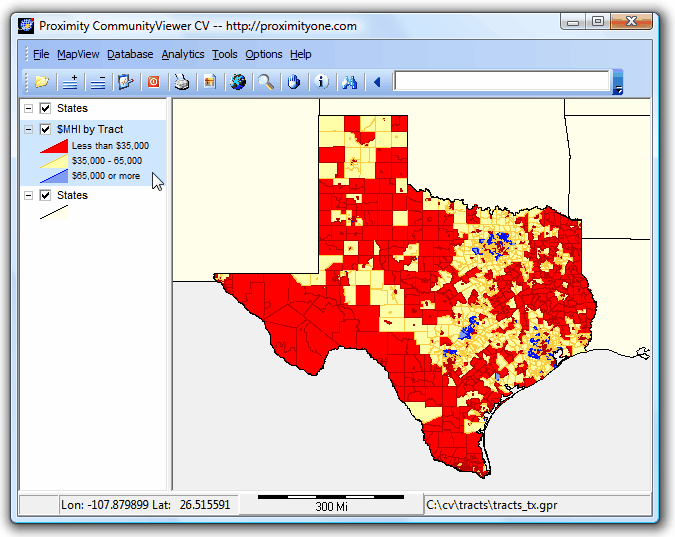
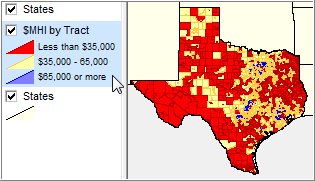 Create thematic maps, such as the one shown at right, for the U.S. or any state using the Proximity national scope or state by census tract shapefiles with integrated demographics. This map shows the pattern of median household income by census tract for Texas. The map was developed using the CommunityViewer (CV -- http://proximityone.com/cv.htm) GIS software. Examine wide-ranging demographic subject matter; choose from hundreds of ready-to-use demographic subject matter items (see list) to meet your needs. This section reviews how you can acquire and use these resources and covers these topics: