Hawaii 114th Congressional Districts |

|

|

|

|

|
||
Hawaii 114th Congressional Districts |

|

|

|

|

|

|
|
|
||
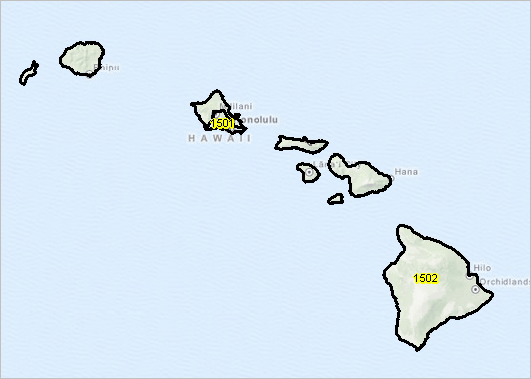
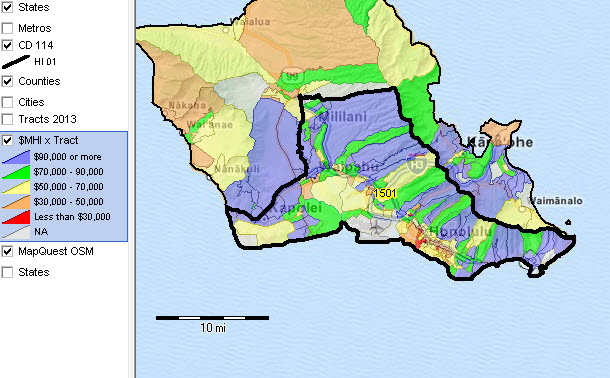
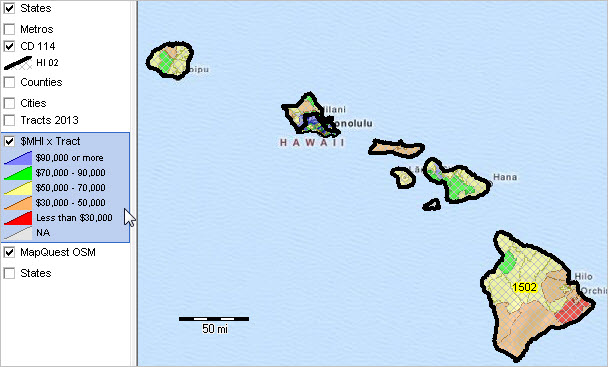
This section uses the CV XE GIS software and related Geographic Information System (GIS) project to examine patterns of economic prosperity by neighborhood by 114th Congressional District. View/analyze 114th CDs in context of wide ranging other geography. Zoom-in to specific CDs. The 114th Congress is in session January 2015 to January 2017. See more about Congressional Districts: • Congressional District demographic-economic interactive tables • Create custom Congressional District maps. The initial graphic shows a statewide view of 114th Congressional Districts. Individual 114th CD views follow the state view. Individual CD focus maps show the CD boundary in context with a Census 2010 census tract thematic map. Patterns of economic prosperity are shown based on American Community Survey 2013 estimates of median household income (MHI). In CD focus maps, see colors associated with MHI intervals in legend at left of map view. Hundreds of other subject matter are available. about these maps ... terms of use ... table of contents ... CV XE GIS ... Situation & Outlook |

HI CD 01 "more southern" part of Honolulu County; remainder of Honolulu County and State are CD 02.
Patterns of economic prosperity by neighborhood: median household income by census tract.
about these maps ... terms of use ... table of contents ... CV XE GIS ... Situation & Outlook

HI CD 02 all Hawaii except "more southern" part of Honolulu County.
Patterns of economic prosperity by neighborhood: median household income by census tract.
about these maps ... terms of use ... table of contents ... CV XE GIS ... Situation & Outlook
