
|
|
|
-- using GIS resources to create custom 113th Congressional District maps -- visual analysis of urban-rural patterns Use the methods, data and tools described here to develop custom congressional district maps. View patterns of economic prosperity by neighborhood for one or all congressional districts. Flexibly associate a congressional district boundary with related geography and subject matter. Join the Congressional District-State Legislative District (CDSLD) Group .. be a part of the community. .. click here to join .. there is no cost. See the related section on Making/Using 115th Congressional District Maps. Creating congressional district maps is often specific to a particular analysis, zoom-view, labeling, combination of different geographies or other considerations. While there are no estimates of unemployment by congressional district, using GIS tools it is possible to view/geospatially analyze patterns of unemployment within a congressional district by county, census tract, block group and other geography. This section reviews tools that you can use to flexibly develop your own maps that show U.S. 113th Congressional Districts of interest using Geographic Information System (GIS) tools. The GIS resources enable you to view/show the congressional district boundaries in context with roads, landmarks and other geography. Flexibly add labels. Create pattern views. Add your own data. Metro maps can be saved as a graphic and used in any manner. There are no fees to use resources described in this section. 113th CD urban/rural mapping makes use of the latest latest smoothed boundary shapefiles (July 2014). 113th Congressional District Urban/Rural Patterns Chicago Area -- create similar map view for any area 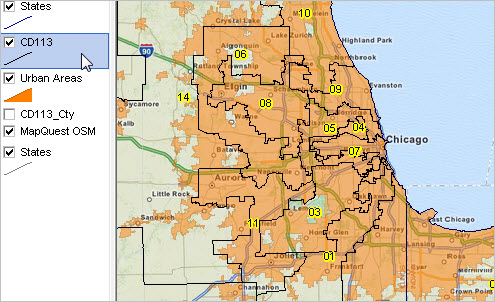 • Congressional districts appear with black boundaries and congressional district code/number. • Urban areas appear with orange fill pattern. It is easy to see which congressional districts are 100% urban. Steps to Develop Custom Congressional District Maps • these steps take only a few minutes and require no special knowledge • requires Windows computer with Internet connection • see about related GIS project and datasets in the Mapping Statistical Data section. 1. Install the ProximityOne CV XE GIS .. run the CV XE GIS installer; requires UserID; take all defaults during installation 2. Download the U.S. 113th Congressional Districts GIS project fileset; requires UserID .. unzip U.S. CD113 Urban Rural GIS project files to local folder c:\cd113_urbanrural 3. Open the c:\cd113_urbanrural\cd113_urbanrural_chicago.gis project .. after completing the above steps, click File>Open>Dialog .. open the file named c:\cd113_urbanrural\cd113_urbanrural_chicago.gis 4. Done. The start-up view is shown above with additional instructions. Using the CD 113 Urban/Rural Maps Projects There are three GIS project files included with the ZIP file. Each GIS project (*.gis) includes the same set of layers/shapefiles. Only attributes of layers set by the CV XE GIS Layer Editor differ. 1. cd113_urbanrural1.gis 2. cd113_urbanrural2.gis 3. cd113_urbanrural_chicago.gis Modifying Layer Settings with Layer Editor With the Metro Maps project open ... • Dbl-click the name of the layer of interest in the Legend Panel at left of Map Window. • The Layer Editor form opens. Here you can set attributes of shapes in this layer and how they are shown in the Map Window. • To set queries that determine which shapes are shown in the Map Window, click the Section tab. • To modify a color or pattern of shapes, click the Area tab. • To set a label for shapes to be shown in the Map Window, click the Label tab. • Click the OK button when layer settings are as desired, closing the Layer Editor. • A project must be saved to permanently update the layer settings. 1. Houston Area -- cd113_urbanrural1.gis When the c:\cd113_urbanrural\cd113_urbanrural1.gis is opened, the view shown below appears. This project illustrates use of the query "GEOID='4822'" placed on the CD113 layer displays only the congressional district Texas 22. 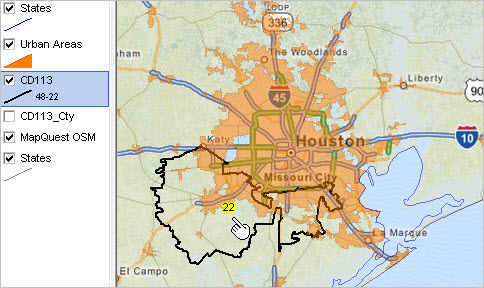 2. Houston Area; Congressional District by County -- cd113_urbanrural2.gis When the c:\cd113_urbanrural\cd113_urbanrural2.gis is opened, the view shown below appears. This project illustrates use of three queries placed on the CD113 by county layer, resulting in the displays of congressional district Texas 22 by county (three color patterns). 1. query 1: CD113FP='22' and countyfp='039' 2. query 2: CD113FP='22' and countyfp='201' 3. query 3: CD113FP='22' and countyfp='157' 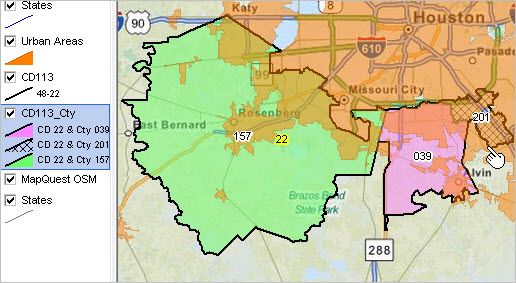 3. Chicago Area -- cd113_urbanrural_chicago.gis When the c:\cd113_urbanrural\cd113_urbanrural_chicago.gis is opened, the view shown below appears. In this project, no queries are placed on any layer. Saving/Publishing a Map View When you have a view that you want to save, click the Save to Image button on the toolbar. You will then be prompted for the folder and filename. Once the graphic has been saved to a folder it can be used just as any other graphic. Saving, Closing and Opening Projects If CV XE GIS is closed with no changes made to the project settings are saved. Reopening the project will create the same start-up view as shown above. Repeat the steps to create views for other cities. If you have made adjustments to the project and want to save it, to be reopened later with the same view, use File>SaveAs to save a new project name. It is recommended that you do not save the project with the same name as you will not be able to recall the original start-up view. Additional Views Phoenix area 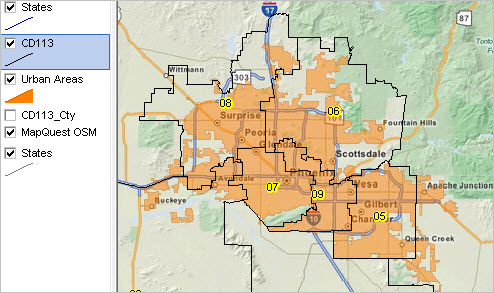 Los Angeles area 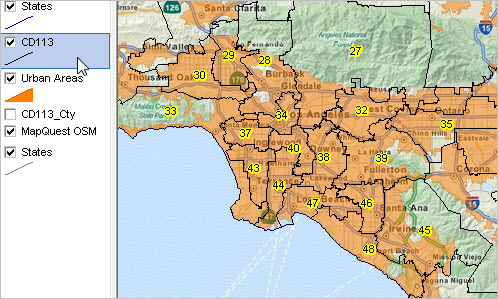 Houston area 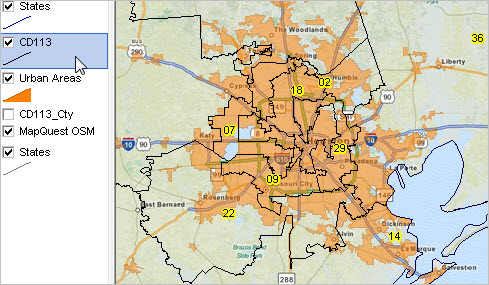 Support Using these Resources Learn more about demographic economic data and related analytical tools. Join us in a Data Analytics Lab session. Each informal session is focused on a specific topic. The open structure also provides for Q&A and discussion of application issues of interest to participants. ProximityOne User Group Join the ProximityOne User Group to keep up-to-date with new developments relating to geographic-demographic-economic decision-making information resources. Receive updates and access to tools and resources available only to members. Use this form to join the User Group. Additional Information ProximityOne develops geodemographic-economic data and analytical tools and helps organizations knit together and use diverse data in a decision-making and analytical framework. We develop custom demographic/economic estimates and projections, develop geographic and geocoded address files, and assist with impact and geospatial analyses. Wide-ranging organizations use our tools (software, data, methodologies) to analyze their own data integrated with other data. Follow ProximityOne on Twitter at www.twitter.com/proximityone. Contact us (888-364-7656) with questions about data covered in this section or to discuss custom estimates, projections or analyses for your areas of interest. |
|
|