Integrated Data Profile

Contents
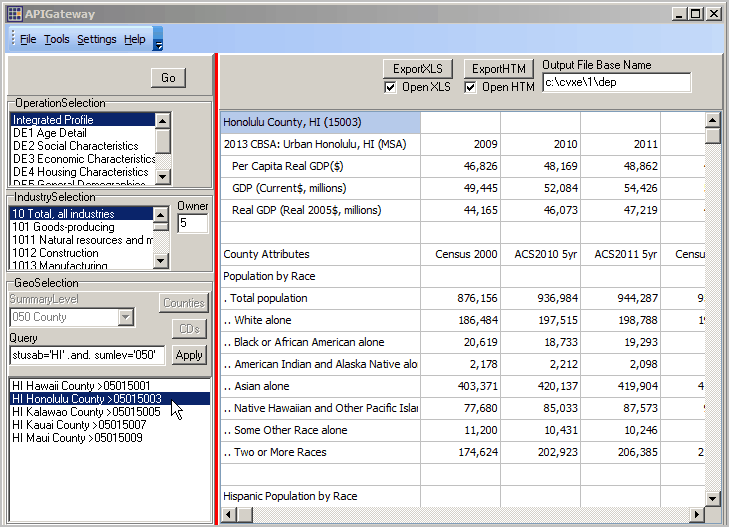
File>APIGateway enables access to demographic-economic subject matter via API calls. Query, view, analyze, download data to the census block and block group levels using API technology.
The Integrated Data Profile (IDP) pulls together selected key demographic-economic items into a profile structure. Helping you eliminate the time and need to merge differently sourced data. Continuously updated. Providing time coverage from 2000 to last month.
Availability
Levels Viewer, 1, 2, 3
Integrated Data Profile available for any county.
Viewer IDP available only at county level; all U.S.
Illustrating accessing and displaying integrated longitudinal data display for Honolulu County, HI
... data from Census 2000, ACS 2010, ACS 2011, ACS 2012 Census 2010, post-Census 2010 estimates, selected labor force characteristics series
... exportable to HTML and/or XLS
... automatically update monthly
... other examples (using manufacturing sector establishment, employment, payroll series):
... Honolulu County, HI ... Warren County, IA ... Allen County, KS ... Harris County, TX (Houston)
Sample Integrated Profile (created using Export HTM button in above view)
... click on links in following HTML to view charts and details.
| Honolulu County, HI (15003) | Census 2000 | ACS2010 5yr | ACS2011 5yr | Census 2010 | ACS2012 5yr | 7.1.10 Estimate | 7.1.11 Estimate | 7.1.12 Estimate | |||||
| Population by Race | |||||||||||||
| . Total population | 876,156 | 936,984 | 944,287 | 953,207 | ... | 956,481 | 966,363 | 976,372 | |||||
| .. White alone | 186,484 | 197,515 | 198,788 | 198,732 | ... | 205,295 | 211,597 | 219,187 | |||||
| .. Black or African American alone | 20,619 | 18,733 | 19,293 | 19,256 | ... | 20,048 | 23,590 | 26,894 | |||||
| .. American Indian and Alaska Native alone | 2,178 | 2,212 | 2,098 | 2,438 | ... | 2,859 | 3,061 | 3,271 | |||||
| .. Asian alone | 403,371 | 420,137 | 419,904 | 418,410 | ... | 425,664 | 424,186 | 422,319 | |||||
| .. Native Hawaiian and Other Pacific Islander alone | 77,680 | 85,033 | 87,573 | 90,878 | ... | 93,045 | 93,360 | 93,362 | |||||
| .. Some Other Race alone | 11,200 | 10,431 | 10,246 | 10,457 | ... | ... | ... | ... | |||||
| .. Two or More Races | 174,624 | 202,923 | 206,385 | 213,036 | ... | 209,570 | 210,569 | 211,339 | |||||
| Hispanic Population by Race | |||||||||||||
| . Hispanic, Total | 58,729 | 74,077 | 76,360 | 77,433 | 77,889 | 82,033 | 85,789 | ||||||
| .. Hispanic - White alone | 10,851 | 16,411 | 17,391 | 17,048 | 23,611 | 26,615 | 29,818 | ||||||
| .. Hispanic - Black alone | 1,036 | 1,272 | 1,272 | 1,327 | 2,122 | 2,393 | 2,618 | ||||||
| .. Hispanic - AIAN alone | 604 | 893 | 864 | 739 | 1,161 | 1,206 | 1,293 | ||||||
| .. Hispanic - Asian alone | 6,840 | 9,900 | 10,043 | 8,391 | 11,175 | 11,260 | 11,235 | ||||||
| .. Hispanic - NHPI alone | 3,250 | 3,415 | 3,551 | 4,643 | 5,829 | 5,887 | 5,865 | ||||||
| .. Hispanic - Some Other Race alone | 9,667 | 9,342 | 9,133 | 9,170 | ... | ... | ... | ||||||
| .. Hispanic - Two or More Races | 26,481 | 32,844 | 34,106 | 36,115 | 33,991 | 34,672 | 34,960 | ||||||
| Population by Age | 876,156 | 936,984 | 944,287 | 953,207 | 956,481 | 966,363 | 976,372 | ||||||
| .. 0- 4 years | 56,849 | 61,178 | 61,582 | 61,261 | 61,374 | 62,607 | 62,725 | ||||||
| .. 5- 9 years | 60,425 | 54,964 | 55,332 | 57,818 | 57,943 | 58,097 | 58,762 | ||||||
| .. 10-14 years | 57,574 | 56,991 | 57,212 | 56,147 | 56,359 | 55,938 | 55,433 | ||||||
| .. 15-19 years | 57,176 | 60,252 | 60,022 | 60,344 | 60,298 | 58,628 | 56,926 | ||||||
| .. 20-24 years | 65,376 | 72,487 | 72,312 | 73,203 | 73,007 | 76,677 | 80,069 | ||||||
| .. 25-29 years | 64,744 | 70,689 | 71,788 | 71,667 | 71,674 | 74,791 | 78,109 | ||||||
| .. 30-34 years | 65,880 | 60,652 | 61,725 | 62,779 | 63,003 | 65,630 | 68,444 | ||||||
| .. 35-39 years | 70,573 | 62,173 | 61,219 | 61,956 | 61,928 | 60,720 | 60,732 | ||||||
| .. 40-44 years | 66,705 | 65,169 | 64,790 | 63,340 | 63,657 | 63,461 | 63,347 | ||||||
| .. 45-49 years | 61,357 | 66,083 | 65,853 | 66,376 | 66,392 | 65,031 | 63,124 | ||||||
| .. 50-54 years | 55,882 | 64,229 | 64,647 | 65,348 | 65,780 | 65,022 | 64,069 | ||||||
| .. 55-59 years | 42,705 | 57,539 | 58,540 | 60,387 | 60,888 | 61,308 | 61,709 | ||||||
| .. 60-64 years | 33,173 | 51,172 | 53,166 | 54,091 | 54,852 | 55,820 | 55,496 | ||||||
| .. 65-69 years | 31,325 | 36,491 | 38,288 | 39,927 | 40,139 | 41,875 | 44,604 | ||||||
| .. 70-74 years | 31,149 | 28,728 | 28,825 | 29,000 | 29,127 | 29,835 | 30,902 | ||||||
| .. 75-79 years | 26,072 | 26,562 | 26,409 | 25,223 | 25,230 | 24,755 | 24,360 | ||||||
| .. 80-84 years | 16,432 | 21,511 | 21,583 | 21,980 | 22,146 | 22,067 | 21,988 | ||||||
| .. 85 years or more | 12,759 | 20,114 | 20,994 | 22,360 | 22,684 | 24,101 | 25,573 | ||||||
| Civilian Labor Force | 462,843 | 467,105 | ... | ||||||||||
| .. Male | 239,511 | 240,930 | ... | ||||||||||
| .. Female | 223,332 | 226,175 | ... | ||||||||||
| Median Household Income ($) | 70,093 | 71,263 | ... | ||||||||||
| BLS QCEW Industry: 10 Owner: 5 | |||||||||||||
| 10 Total, all industries | Jan | Feb | Mar | Apr | May | Jun | Jul | Aug | Sep | Oct | Nov | Dec | Annual |
| .. Employment 2010 | 330,337 | 331,859 | 332,769 | 332,332 | 333,580 | 333,244 | 333,504 | 334,252 | 336,421 | 337,390 | 339,073 | 343,119 | 334,823 |
| .. Employment 2011 | 333,946 | 337,321 | 339,394 | 337,089 | 337,308 | 337,912 | 339,134 | 340,551 | 342,788 | 342,413 | 345,959 | 348,923 | 340,228 |
| .. Employment 2012 | 340,575 | 342,277 | 343,343 | 344,171 | 346,603 | 347,315 | 347,357 | 349,492 | 350,081 | 350,334 | 354,551 | 356,692 | 347,733 |
| .. Employment 2013 | |||||||||||||
| 10 Total, all industries | Q1 | Q2 | Q3 | Q4 | Annual | ||||||||
| .. Establishments 2010 | 23,626 | 23,772 | 23,847 | 24,059 | 23,826 | ||||||||
| .. Establishments 2011 | 23,516 | 23,568 | 23,708 | 23,914 | 23,677 | ||||||||
| .. Establishments 2012 | 23,632 | 23,825 | 24,104 | 24,251 | 23,953 | ||||||||
| .. Establishments 2013 | |||||||||||||
| 10 Total, all industries | Q1 | Q2 | Q3 | Q4 | Annual | ||||||||
| .. Total Wages ($000) 2010 | 3,250,381 | 3,287,284 | 3,409,276 | 3,806,389 | 13,753,330 | ||||||||
| .. Total Wages ($000) 2011 | 3,417,189 | 3,392,536 | 3,606,634 | 3,792,213 | 14,208,572 | ||||||||
| .. Total Wages ($000) 2012 | 3,645,174 | 3,594,108 | 3,636,150 | 4,049,818 | 14,925,250 | ||||||||
| .. Total Wages ($000) 2013 | |||||||||||||
| 10 Total, all industries | Q1 | Q2 | Q3 | Q4 | Annual | ||||||||
| .. Average Weekly Wages ($) 2010 | 754 | 759 | 783 | 862 | 790 | ||||||||
| .. Average Weekly Wages ($) 2011 | 780 | 773 | 814 | 844 | 803 | ||||||||
| .. Average Weekly Wages ($) 2012 | 820 | 799 | 801 | 880 | 825 | ||||||||
| .. Average Weekly Wages ($) 2013 | |||||||||||||
| BLS LAU | |||||||||||||
| Labor Force: LAUPS15007006 | Jan | Feb | Mar | Apr | May | Jun | Jul | Aug | Sep | Oct | Nov | Dec | Annual |
| .. Labor Force 2011 | 456,974 | 460,181 | 462,269 | 462,544 | 460,293 | 460,735 | 460,550 | 455,449 | 457,815 | 457,917 | 461,272 | 459,924 | 459,660 |
| .. Labor Force 2012 | 460,756 | 461,222 | 461,504 | 459,141 | 458,613 | 456,981 | 456,007 | 452,289 | 455,221 | 455,822 | 458,457 | 459,870 | 457,990 |
| .. Labor Force 2013 | 456,079 | 458,213 | 452,963 | 454,836 | 456,289 | 456,775 | 449,705 | .. | .. | .. | .. | .. | .. |
| BLS LAU | |||||||||||||
| Employment: LAUPS15007005 | Jan | Feb | Mar | Apr | May | Jun | Jul | Aug | Sep | Oct | Nov | Dec | Annual |
| .. Employment 2011 | 431,326 | 435,397 | 438,244 | 439,413 | 435,733 | 432,572 | 433,564 | 428,988 | 430,605 | 431,656 | 435,310 | 436,068 | 434,073 |
| .. Employment 2012 | 435,238 | 436,222 | 436,401 | 435,909 | 434,503 | 429,653 | 430,994 | 429,145 | 432,633 | 433,835 | 437,165 | 440,370 | 434,339 |
| .. Employment 2013 | 434,245 | 437,483 | 433,031 | 437,070 | 438,098 | 435,507 | 430,809 | .. | .. | .. | .. | .. | .. |
| BLS LAU | |||||||||||||
| Unemployment: LAUPS15007004 | Jan | Feb | Mar | Apr | May | Jun | Jul | Aug | Sep | Oct | Nov | Dec | Annual |
| .. Unemployment 2011 | 25,648 | 24,784 | 24,025 | 23,131 | 24,560 | 28,163 | 26,986 | 26,461 | 27,210 | 26,261 | 25,962 | 23,856 | 25,587 |
| .. Unemployment 2012 | 25,518 | 25,000 | 25,103 | 23,232 | 24,110 | 27,328 | 25,013 | 23,144 | 22,588 | 21,987 | 21,292 | 19,500 | 23,651 |
| .. Unemployment 2013 | 21,834 | 20,730 | 19,932 | 17,766 | 18,191 | 21,268 | 18,896 | .. | .. | .. | .. | .. | .. |
| BLS LAU | |||||||||||||
| Unemployment Rate: LAUPS15007003 | Jan | Feb | Mar | Apr | May | Jun | Jul | Aug | Sep | Oct | Nov | Dec | Annual |
| .. Unemployment rate 2011 | 5.6 | 5.4 | 5.2 | 5.0 | 5.3 | 6.1 | 5.9 | 5.8 | 5.9 | 5.7 | 5.6 | 5.2 | 5.6 |
| .. Unemployment rate 2012 | 5.5 | 5.4 | 5.4 | 5.1 | 5.3 | 6.0 | 5.5 | 5.1 | 5.0 | 4.8 | 4.6 | 4.2 | 5.2 |
| .. Unemployment rate 2013 | 4.8 | 4.5 | 4.4 | 3.9 | 4.0 | 4.7 | 4.2 | .. | .. | .. | .. | .. | .. |
| Notes | |||||||||||||
| "..." data not available for this item | |||||||||||||
| Usage, Structure and Sources | |||||||||||||
| Developed using CV XE GIS APIGateway | |||||||||||||
| Additional Information: (888)364-7656 |
The profile is comprised of upper and lower sections. The column structure differs between the upper and lower sections
The upper section includes annual data with these column headers and data sources:
Census 2000 Census 2000 Summary File 1 -- http://proximityone.com/cen2000.htm (4/1/10)
ACS2010 5Yr American Community Survey 2010 5 Year Estimates -- http://proximityone.com/acs0610.htm
ACS2011 5Yr American Community Survey 2011 5 Year Estimates -- http://proximityone.com/acs0711.htm
Census 2010 Census 2010 Summary File 1 -- http://proximityone.com/cen2010_sf1.htm (4/1/10)
ACS2012 5Yr American Community Survey 2012 5 Year Estimates -- http://proximityone.com/acs0812.htm
7.1.10 estimates Census Population Estimate 2010 (July 1, 2010)
7.1.11 estimates Census Population Estimate 2011 (July 1, 2011)
7.1.12 estimates Census Population Estimate 2012 (July 1, 2012)
Post Census 2010 model-based population estimates do not show data for "some other race." See comparability notes regarding 7.1.10-7.1.12 estimate.
The lower section includes quarterly and monthly data with month, quarter or year header columns:
Series Group 1 Bureau of Labor Statistics Quarterly Census of Wages and Employment (QCEW)
Series Group 2 Bureau of Labor Statistics Local Area Unemployment Statistics (LAUS)
Optional More Detailed Content
| • | ProximityOne Demographic-Economic Estimates and Projections |
| • | Extended subject matter from sources 1-3 above |
Operations
Use one of these options to display integrated data profile in grid:
| • | dbl-click a county in lower left GeoSelection listbox to display integrated data profile in grid, |
| • | dbl-click an industry in Industry Selection listbox to display integrated data profile in grid, |
| • | click Go button to display integrated data profile in grid. |
Industry Selection
| • | Determines which QCEW NAICS/type of business is displayed. |
| • | Does not affect other data displays. |
| • | Applicable only to QCEW data. |
| • | Owner: 5: private; 1: total |
GeoSelection Query
Use this feature to specify what areas are shown in the GeoSelection listbox.
To select New York counties, modify the Query to stusab='NY' and then click apply.
Use any USPS state abbreviation.
Population estimates comparability
The Census Bureau annual Post-Census 2010 population estimates are developed using a modified race methodology. The "Some Other Race" population is allocated to specific race categories. Population data for other programs (e.g. Census 2010) do use the "Some Other Race" category.
A specified race response is a response of one or more of the five Office of Management and Budget (OMB) race categories: White; Black or African American; American Indian and Alaska Native; Asian; Native Hawaiian and Other Pacific Islander. A non-specified race response is a response of Some Other Race.
For Census 2010 and earlier race responses:
| • | Single or multiple race responses that include only specified OMB races. |
| • | Single race responses of a non-specified race (Some Other Race alone). |
| • | Two or more race responses that include both the specified OMB race(s) and the nonspecified response, Some Other Race. |
Post Census 2010 Population Estimates Modification (thus not using Some Other Race category)
| • | No modification was made for race responses where only a specified OMB race was provided alone or in combination with one or more OMB races (e.g., White alone, White and Black or African American; White and Black or African American and American Indian and Alaska Native). |
| • | Non-specified race responses of Some Other Race alone were modified by blanking the non-specified race response and allocating a specified OMB race alone or in combination. Race was allocated from a donor within the household that matched on Hispanic origin. If a donor could not be found within the household, a race was allocated from a hot deck matrix where the donor and donee matched on the specific Hispanic origin (Not Hispanic or Latino; Mexican; Puerto Rican; Cuban; Central American and Dominican; South American; other Spanish). |