Horseheads CSD NY Census 2010 & Demographic Economic Patterns & Trends

Contents
Selected CommunityViewer project/application views in New York.
Click toggle in Table of Contents at left to view sub-state applications.
Integrating Census 2010 TIGER Shapefiles, ACS 2009 5-year demographics, Census 2010 demographics and related data
See related interactive ranking tables:
| • | New York school district demographics: http://proximityone.com/sd_ny.htm. |
| • | New York census tract demographics: http://proximityone.com/ustr0509_ny.htm. |
| • | Census 2010 demographics: http://proximityone.com/cen2010_pl94171.htm |
(all US geography: state, congressional district, county, school district, city/place, metro)
Viewing Horseheads School District with Google mapping ... more about this process.
Horseheads School District in context of Chemung County, NY and Elmira, NY Metro
More about metros and Situation & Outlook
| • | Metropolitan Area Guide: http://proximityone.com/metros/guide |
| • | MetroView: demographic-economic profiles & patterns -- http://proximityone.com/metroview.htm |
The table presented below provides a summary demographic profile for the county based on the Census 2010 P.L. 94-171 data. Similar to a profile developed by Census, this profile also includes two columns providing characteristics for the population under 18 years of age. These profiles are available for any Census 2010 geography, census block and higher level geography.
ProximityOne -- additional details and interactive ranking table
|
||||||||||||||||||||||||||||||||||||||||||||||||||||||||||||||||||||||||||||||||||||||||||||||||||||||||||||||||||||||||||||||||||||||||||||||||||||||||||||||||||||||||||||||||||||||||||||||||||||||||||
The table presented below provides a summary demographic profile for the village based on the Census 2010 P.L. 94-171 data. Similar to a profile developed by Census, this profile also includes two columns providing characteristics for the population under 18 years of age. These profiles are available for any Census 2010 geography, census block and higher level geography.
ProximityOne -- additional details and interactive ranking table
|
||||||||||||||||||||||||||||||||||||||||||||||||||||||||||||||||||||||||||||||||||||||||||||||||||||||||||||||||||||||||||||||||||||||||||||||||||||||||||||||||||||||||||||||||||||||||||||||||||||||||||
The table presented below provides a summary demographic profile for the district based on the Census 2010 P.L. 94-171 data. Similar to a profile developed by Census, this profile also includes two columns providing characteristics for the population under 18 years of age. These profiles are available for any Census 2010 geography, census block and higher level geography.
ProximityOne -- additional details and interactive ranking table
|
||||||||||||||||||||||||||||||||||||||||||||||||||||||||||||||||||||||||||||||||||||||||||||||||||||||||||||||||||||||||||||||||||||||||||||||||||||||||||||||||||||||||||||||||||||||||||||||||||||||||||
The profiles presented below show data from the Census 2010 Demographic Profile Summary File released May 2011.
ProximityOne -- additional information
|
|||||||||||||||||||||||||||||||||||||||||||||||||||||||||||||||||||||||||||||||||||||||||||||||||||||||||||||||||||||||||||||||||||||||||||||||||||||||||||||||||||||||||||||||||||||||||||||||||||||||||||||||||||||||||||||||||||||||||||||||||||||||||||||||||||||||||||||||||||||||||||||||||||||||||||||||||||||||||||||||||||||||||||||||||||||||||||||||||||||||||||||||||||||||||||||||||||||||||||||||||||||||||||||||||||||||||||||||||||||||||||||||||||||||||||||||||||||||||||||||||||||||||||||||||||||||||||||||||||||||||||||||||||||||||||||||||||||||||||||||||||||||||||||||||||||||||||||||||||||||||||||||||||||||||||||||||||||||||||||||||||||||||||||||||||||||||||||||||||||||||||||||||||||||||||||||||||||||||||||||||||||||||||||||||||||||||||||||||||||||||||||||||||||||||||||||||||||||||||||||||||||||||||||||||||||||||||||||||||||||||||||||||||||||||||||||||||||||||||||||||||||||||||||||||||||||||||||||||||||||||||||||||||||||||||||||||||||||||||||||||||||||||||||||||||||||||||||||||||||||
This profile presented below shows age distributions for the state/district by type of enrollment universe. Data centric to mid-2007 are based on the ACS 2009 School District Special Tabulation released May 2011.
Data source: U.S. Department of Education; Bureau of the Census; 2009 American Community Survey SDST. Developed by ProximityOne -- http://proximityone.com. These data are derived from SDST Table B01001 -- gender by age for each tabulation universe. The table presented above shows two data columns for each SDST tabulation universe: Total population -- all ages Total children -- ages 0-19; 18 & 19 not high school graduate Grade relevant children -- Total ** Grade relevant children -- Enrolled and not enrolled ** Grade relevant children -- Enrolled ** Grade relevant children -- Enrolled public ** Grade relevant children -- Enrolled private ** Grade relevant children -- Not enrolled (RCNE) ** ** ages 3-19; 18 & 19 not high school graduate and ages grade relevant to those offered by district; e.g. K-5 or K-12 The two leftmost data columns provide data for the total population and show data for all ages. All other column sets to the right provide only data for population under 19 years by universe definition. |
|||||||||||||||||||||||||||||||||||||||||||||||||||||||||||||||||||||||||||||||||||||||||||||||||||||||||||||||||||||||||||||||||||||||||||||||||||||||||||||||||||||||||||||||||||||||||||||||||||||||||||||||||||||||||||||||||||||||||||||||||||||||||||||||||||||||||||||||||||||||||||||||||||||||||||||||||||||||||||||||||||||||||||||||||||||||||||||||||||||||||||||||||||||||||||||||||||||||||||||||||||||||||||||||||||||||||||||||||||||||||||||
Census 2000 Demographic Profiles for Horseheads CSD (RTF will open in Word)
Note that DP1 equivalent data are available from Census 2010. DP2-DP4 data are not available from Census 2010 as these subject matter were not included in Census 2010. DP1-DP4 similar data are available census tract level and up from ACS 2009 5-year demographics.
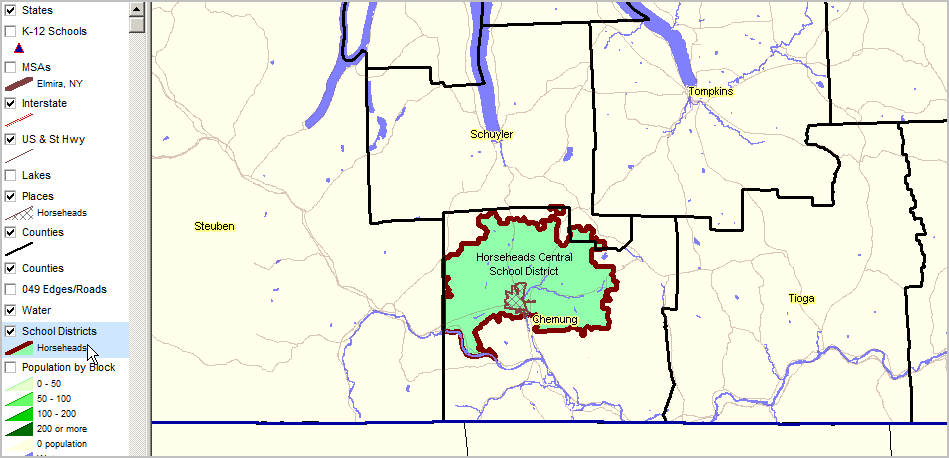
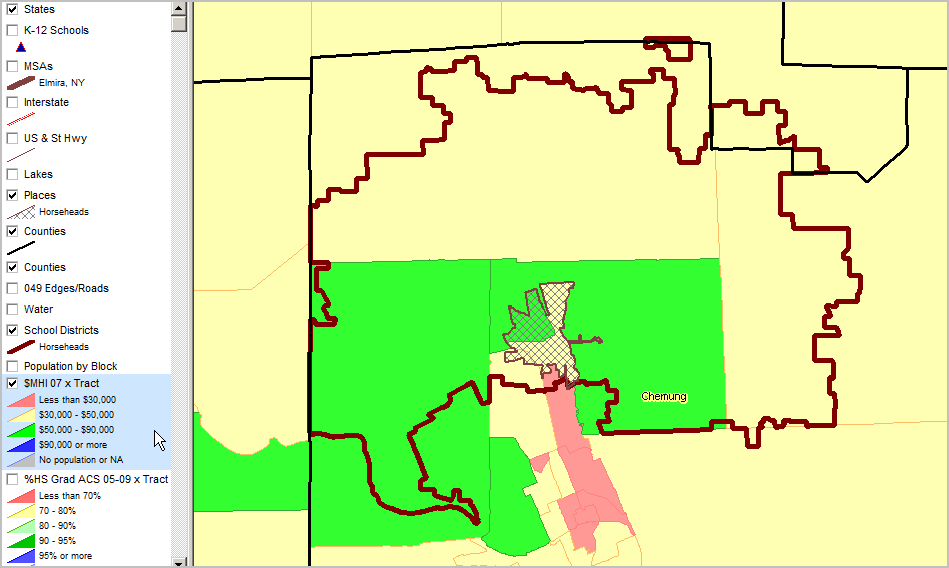
Elmira, NY Metro; Chemung County, NY bold brown boundary. Horseheads School District green fill pattern; Horseheads village crosshatch pattern.
|
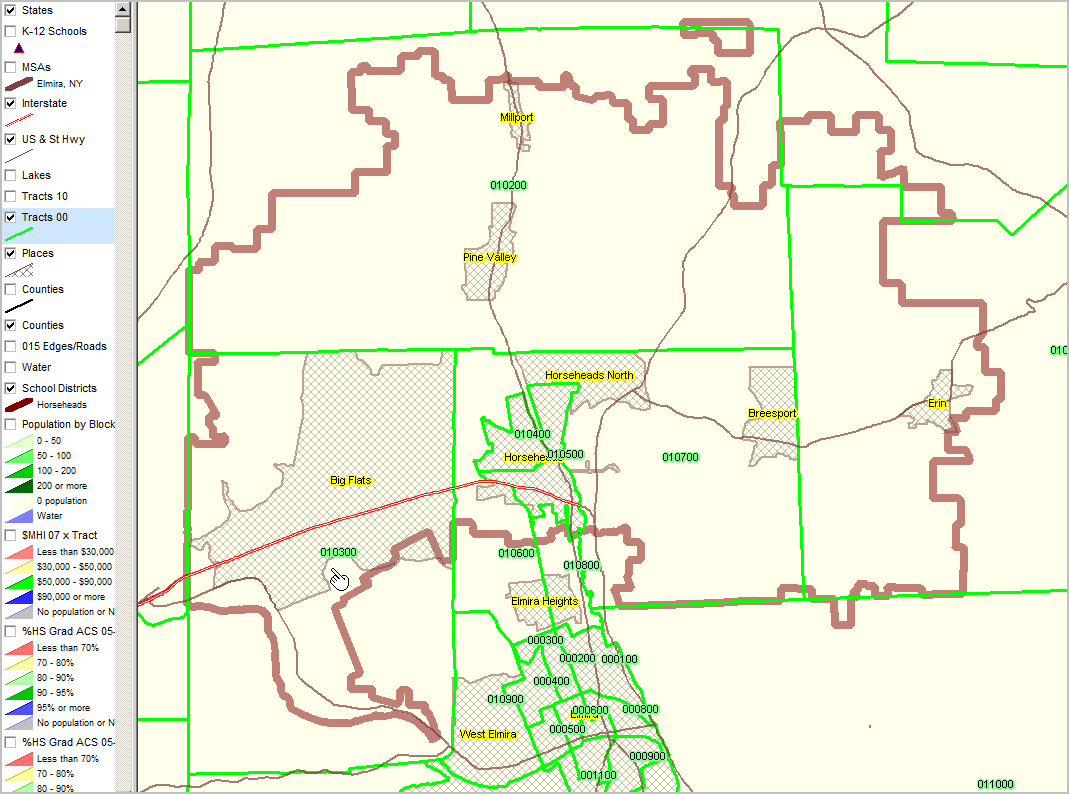
All cities/places cross-hatch pattern with place name yellow label. School district bold brown boundary. Census 2000 tracts (same as Census 2010 in this area) green boundary and census tract code green label. Census tracts align to county boundaries but may cross over any other political/statistical area boundary except block and block group. This view illustrates the relationship between Big Flats CDP, the school district and census tracts ...Big Flats CDP is contained within tract 010300 and mostly but not entirely within the school district.
|
Median household income ($MHI) by census tract. Data based on 2009 American Community Survey (http://proximityone.com/acs.htm) 5-year estimates, centric to mid-2007. See $MHI color patterns in highlighted layer in legend at left of map view.
|
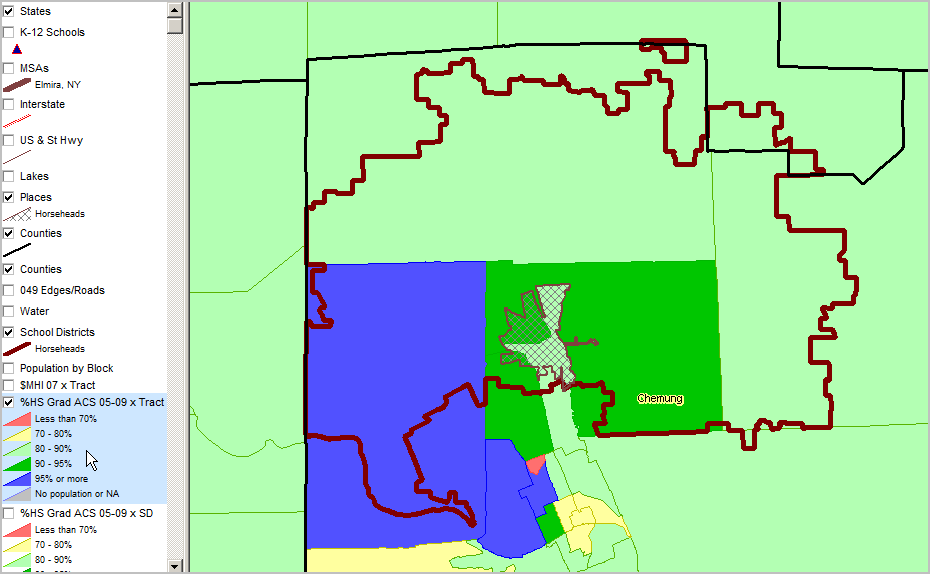
Percent high school graduate (population 25 years and over) by census tract. Data based on 2009 American Community Survey (http://proximityone.com/acs.htm) 5-year estimates, centric to mid-2007. See color patterns in highlighted layer in legend at left of map view.
|
See highlighted (blue) layer in legend (left of map) for color/data value interval definitions. More about these data: http://proximityone.com/cen2010_blocks.htm.
|
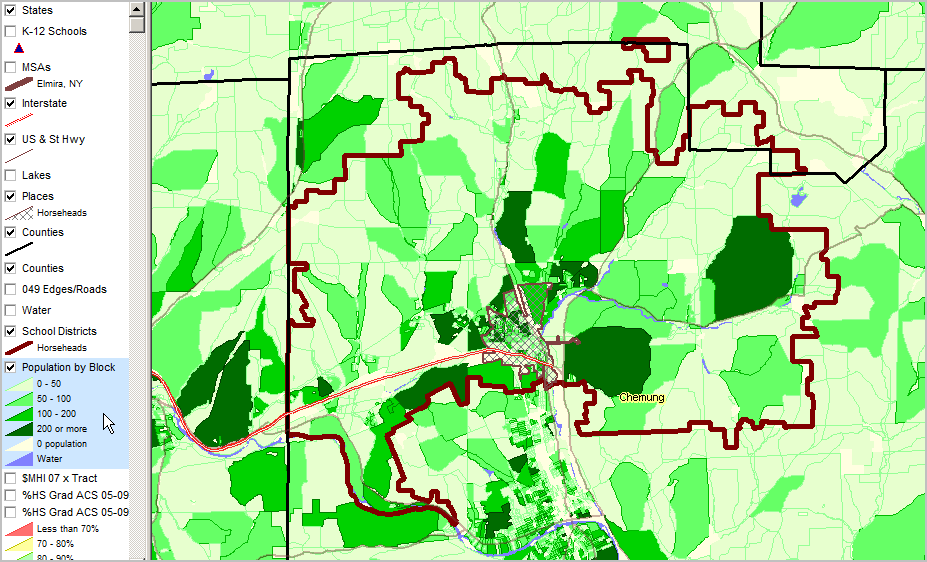
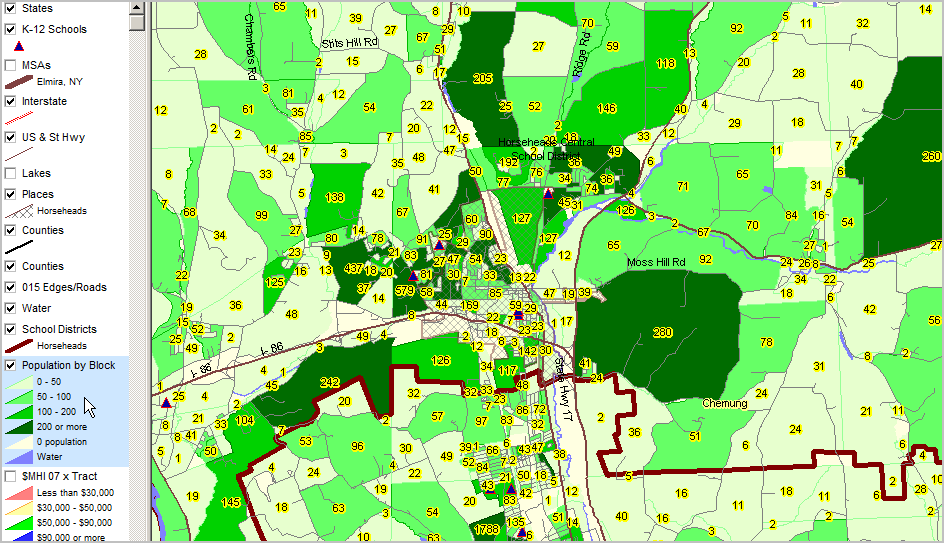
View similar to above showing total population by block as label. Intersection-to-intersection street detail and K-12 schools as blue markers.
|
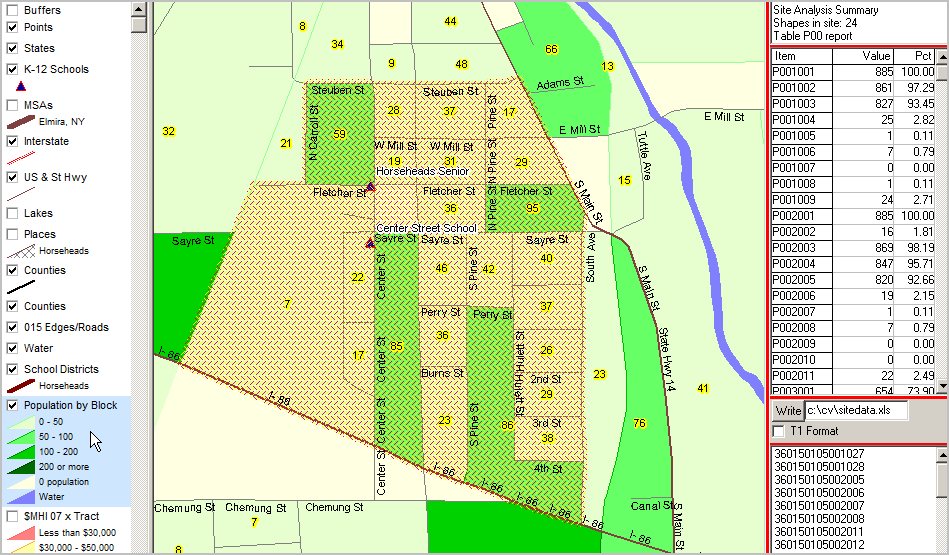
Further zoom-in ... CV Site Analysis operation applied to census block layer; blocks "cherry-picked" in vicinity of school. In the graphic below, table in upper right shows 24 blocks (cross-hatched) in this study area.
Aggregate demographics for selected blocks are shown in the mini table below that count: 885 total population in this set of blocks (p001001); 827 "White population of one race" (p001003) in this set of blocks. 16 Hispanic (p002002) and 869 non-Hispanic (p002003) Item names shown in left column of profile defined at http://proximityone.com/cen2010_blocks.htm.
List of geocodes for blocks included shown in lower right mini table. By clicking "Write" button, the summary data are written to specified spreadsheet file.
|
This section illustrates steps to analyze Horseheads CSD students in the context of attendance zones. These operations make use of the CommunityViewer (CV) Horseheads CSD project (horseheads101410.gpr) updated with 10-14-2010 student data.
This tutorial section shows how to use/modify the project file so that students (student locations and attributes from the student database) can be displayed as markers in the map view with different marker styles for the school attended by the student (markers different for each school). We start with all students shown as a single style red marker. Final steps show how to create a view the existing attendance zones as an overlay "above" the new student data with the new (this section) revised markers.
This section is not intended to replace the CommunityViewer user guide (access via CV from Help menu). This section has been developed for a reader who is generally familiar with a CV school district project file and component layers/shapefiles. Component layers are not defined/described in detail in this section.
Student data for the 2010-11 school year were geocoded, a new geocoded shapefile developed and the shapefile was added to a project. The new shapefile is named c:\cv\nyfiles\hhstudentdata_101410.shp and has been added to the CV project (c:\cv\nyfiles\horseheads101410.gpr).
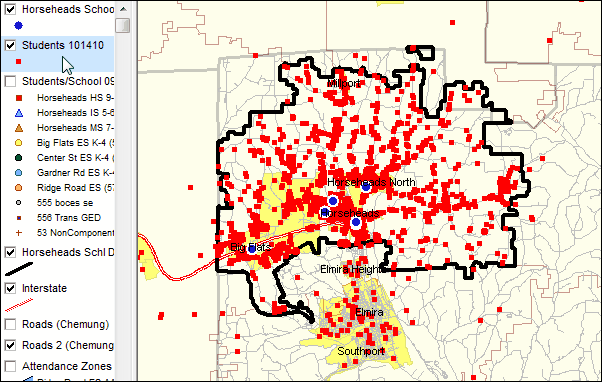
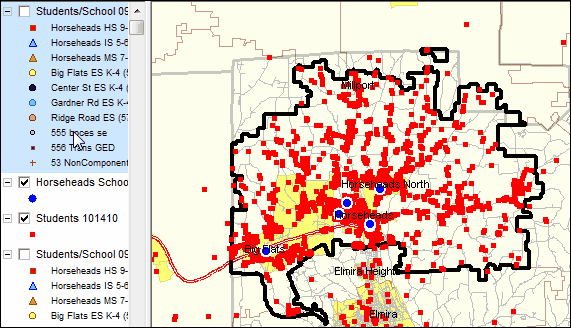
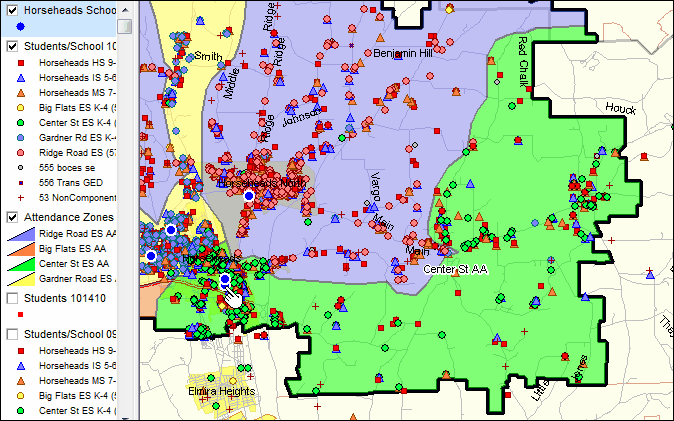
The start-up view of the CV project is shown below. The school district boundary is shown by the bold black boundary. Cities/places are shown with yellow fill pattern. The 10-14-10 student layer (call this std1011) is shown in the legend at left highlighted in blue (active layer). The layer below Students 101410 contains similar student data for the previous year 2009-10 (call this std0910). The std1011 shows all students with a single red box style marker whereas std0910 shows students with different markers by school attended by the student. std1011 markers do not appear in the map view as the layer checkbox is not checked in the legend.
To proceed with a hands-on version of this tutorial, install the project files with the 10-14-2010 data as used in this section (instructions provided separately), start CommunityViewer and open the project file c:\cv\nyfiles\horseheads101410.gpr. The view will appear as shown above.
The next several steps will show the process to modify the project file so that the std1011 layer shows a pattern (set of marker styles) similar to the std0910 layer. There are many ways to do this. The next steps show the fastest method.
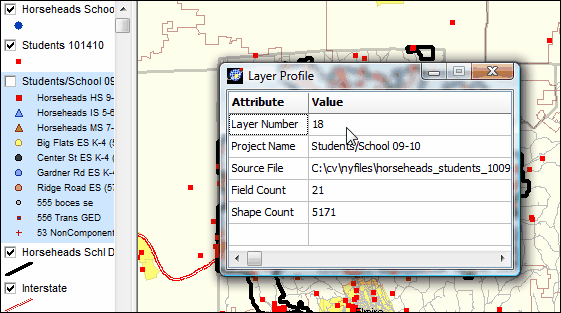
Right-click the stf0910 layer and the layer profile option appears; click the layer profile and the Layer Profile appears:
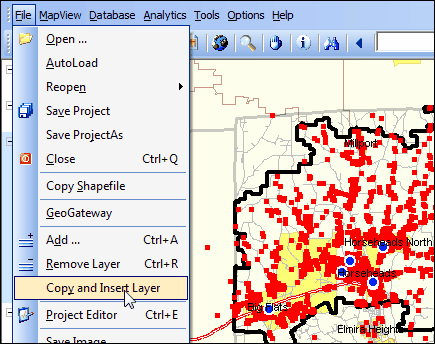
Layer 18 will be copied from the source project file horseheads101410.gpr into the same project file using the File>Copy & Insert operation.
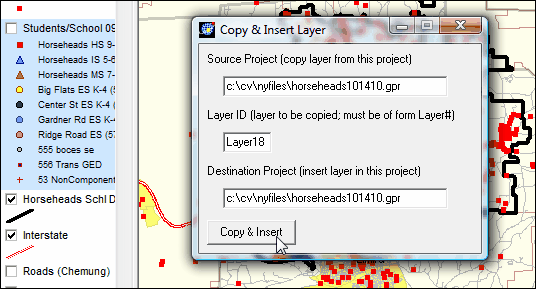
Start the File>Copy & Inset Layer and complete the three edit box values as shown below. Next click the Copy & Insert button.
Close this form. Close the project, Re-open the project c:\cv\nyfiles\horseheads101410.gpr. The project start-up now appears as shown below. Nte the new layer that has been added at the top (legend panel).
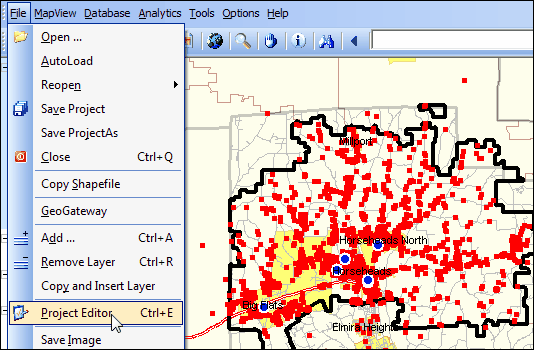
This view shows the same layer (std0910) as the 4th layer. We want it to show the same intervals/student-school assignments buy using data from the std1011 shapefile. We will use the File>Project Editor to modify the project file (c:\cv\nyfiles\horseheads101410.gpr).
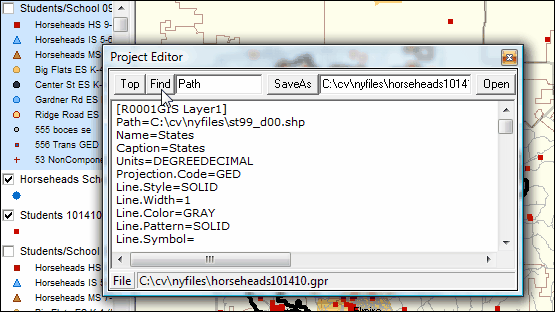
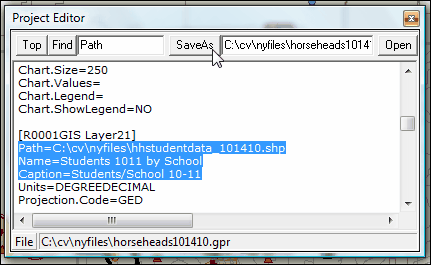
The start-up of the Project Editor appears as shown below.
Click the Find button until you reach Layer 21 ...
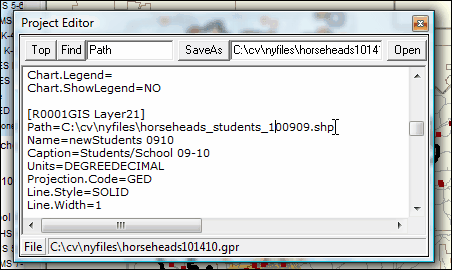
Change EXACTLY, this line Path=C:\cv\nyfiles\horseheads_students_100909.shp to this line Path=C:\cv\nyfiles\hhstudentdata_101410.shp
Change these lines Name=newStudents 0910 Caption=Students/School 09-10 to these values Name=Students 1011 by School Caption=Students/School 10-11
Click the SaveAs button as shown below
Close this form. Close the Project. Re-open the project c:\cv\nyfiles\horseheads101410.gpr
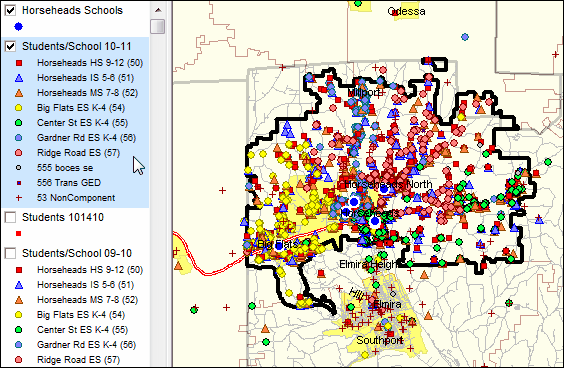
When the revised project opens, click the top layer on and the 3rd layer off. Slide the Schools layer (2) to the top. The view appears as shown below. Use File>Save to save this version of the project. The objective has been completed.
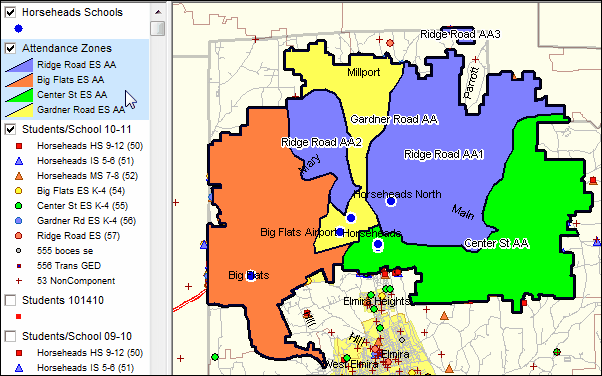
To view attendance zones in a layer "above" the new students layer, slide (in the legend panel) the existing attendance zone layer to the 2nd layer position and click the layer on:
To "see through" the attendance zones, dbl-click the layer name "Attendance Zones" in the legend panel; starting the layer editor:
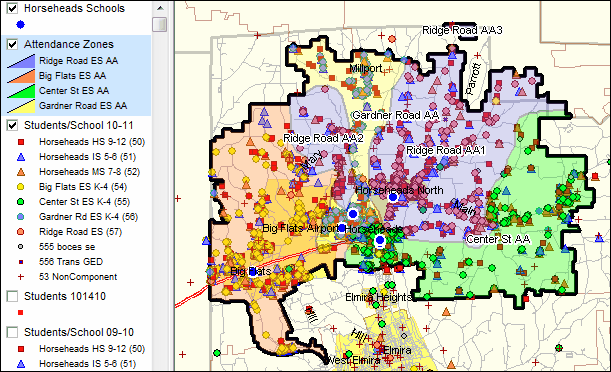
Click the layer tab, change the transparency to 30 and click OK. The view now appears as follows:
This attendance zone change will not be saved. Close the project. The movement of the attendance zone layer and changing the transparency will not be saved. This shows how to dynamically change view(s) without permanently altering the project.
Analyzing attendance zone characteristics by student composition
How many students attend Center Street ES who are residents of the Center Street Attendance Zone?
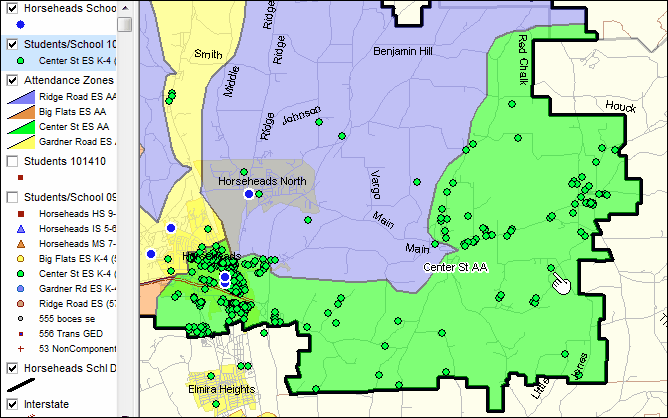
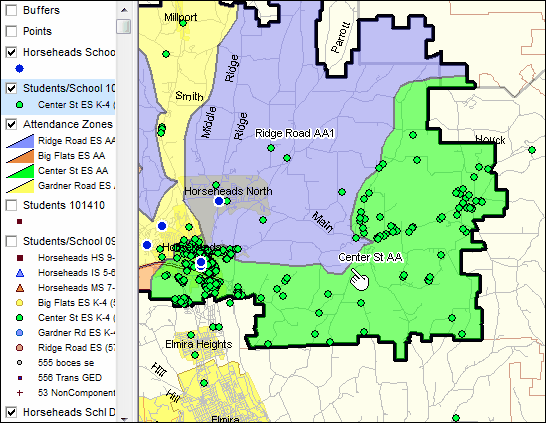
Set layer attributes (in legend) and navigate to the following view. Center St. attendance zone is shown with green fill pattern. Center St. school is shown by the pointer (hand) in map view.
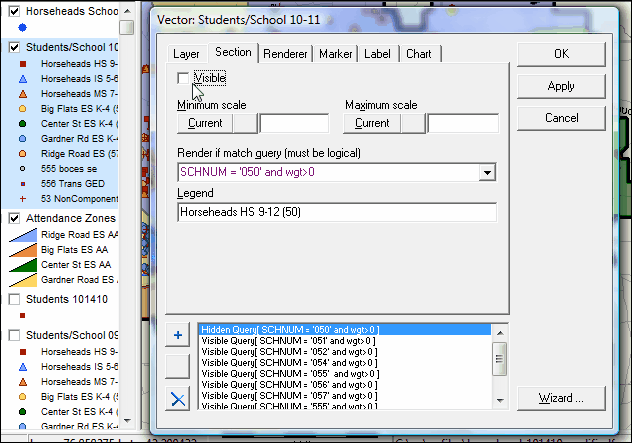
First, the view can be modified so that only students attending Center St. school are shown. To do this, dbl-click the Students/School 1011 layer in the legend (second from top in above view). The Layer Editor starts as shown in the next view. Click the Section tab. Uncheck the Visible checkbox for each section except SCHNUM = '055' (Center St.)
The view now appears as shown below.
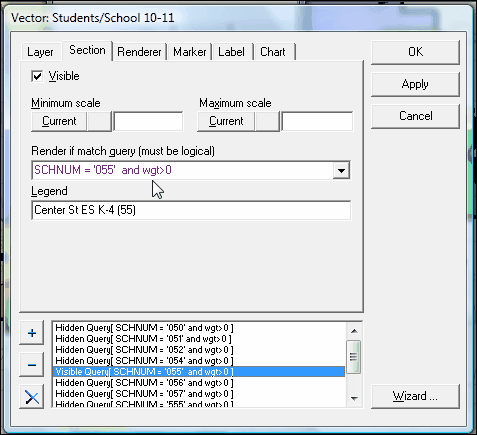
The Layer Editor form now appears as shown below. Only Center St. (055) is checked as visible. Click the OK button.
Counting students
Method 1. Count students Using the Site Analysis Tool
With the Students/School layer the Active Layer, click Tools>Site Analysis. Respond Yes to prompt - is correct layer active?
On the Site Analysis form, select settings as shown below and then click OK.
Make a circle by starting near the pointer as shown in the next graphic and drag to radius that encompasses Center AZ.
As shown in the resulting view there are 426 students in the circle that attend Center St. school
But some of these students are outside of the Center St AZ boundary. How to count the students that are in Center St AZ boundary who attend that school ... and generate a list of those students.
Click Tools>Site Analysis to turn off Site Analysis operations.
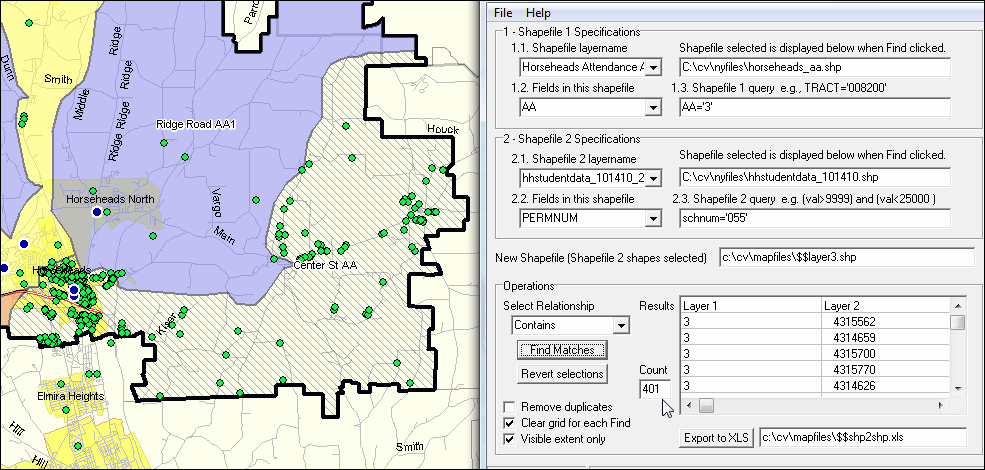
Method 2. Count students using the Shape2Shape Relationships Tool
Start Tools>Shp2Shp Relationships
Select 1.1. shapefile as shown in form above. Code the query as shown in 1.3. Select 2.1. shapefile as shown in the form above. Code the query as shown in 2.3. Change the Select Relationship to Contains. Click Find Matches button. The matches view shows there are 401 students (see pointer in right form below) that meet this criteria as shown in the next graphic. Click the button Export to XLS to save the list of student that met these conditions.
A next section (to be added later) will illustrate viewing demographic characteristics in more detail. |