

Collin County, TX |

|

|

|

|

|
||
Collin County, TX |
|
|
|
|

|

|
|
|
||
This section provides examples using the DDA Viewer for a study area in Collin County, TX.
See related section in Applications Gallery -- http://proximityone.com/gallery/guide/tx_mckinney.htm
Developing insights ... examining demographic patterns and change by neighborhood in McKinney ISD, TX.
... see how a 3-census tract study area (as an example) changed from 16,322 population in 2008 to 17,036 population in 2010
... select your own study area using DDA Viewer.
... examine "richer demographics" based on the ACS 2010 data not available from Census 2010.
... examine/compare/contrast attributes of individual tracts.
... examine demographics for total area and how the population is changing.
The CommunityViewer (CV) GIS software (http://proximityone.com/cv.htm) site analysis tool is used to select geography for analysis in the DDA Viewer. Census tracts are used in this application.
The geographic area codes are saved to a file that is then processed by DDA Viewer.
Using CommunityViewer GIS
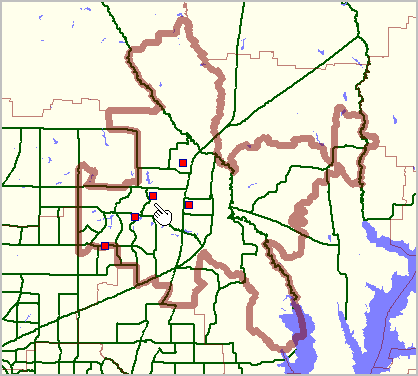
A CV GIS project is opened. The following project view shows the boundary of McKinney ISD school district (bolded semi-transparent brown boundary) located in Collin County. Census 2010 census tracts are shown with green boundaries. Selected schools are shown as red markers.
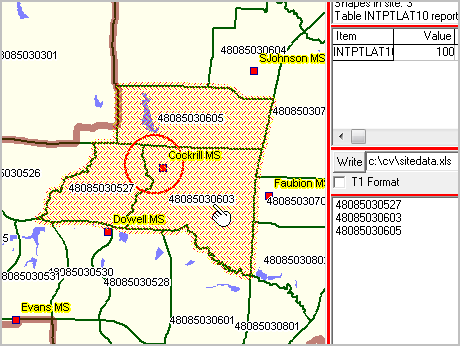
The next view shows a zoom-in with census tract labels/codes. For example, (see tract just above red circle), the census tract code 48085030603 is the combined state (48), county (085) and Census 2010 tract (030603) uniquely identifying this tract among all 73,057 tracts covering the U.S. The name of this geocode field, used in CV and DDA, is "GEOID".
Cherry pick or use circle/radius selection tool to select areas to be included in the site selection file. In this application, three tracts are selected. When the site analysis operation is closed/completed, a geographic selections file is created and ready for use in DDA.
Using DDA
CV is closed. DDA is started. Viewer is started.
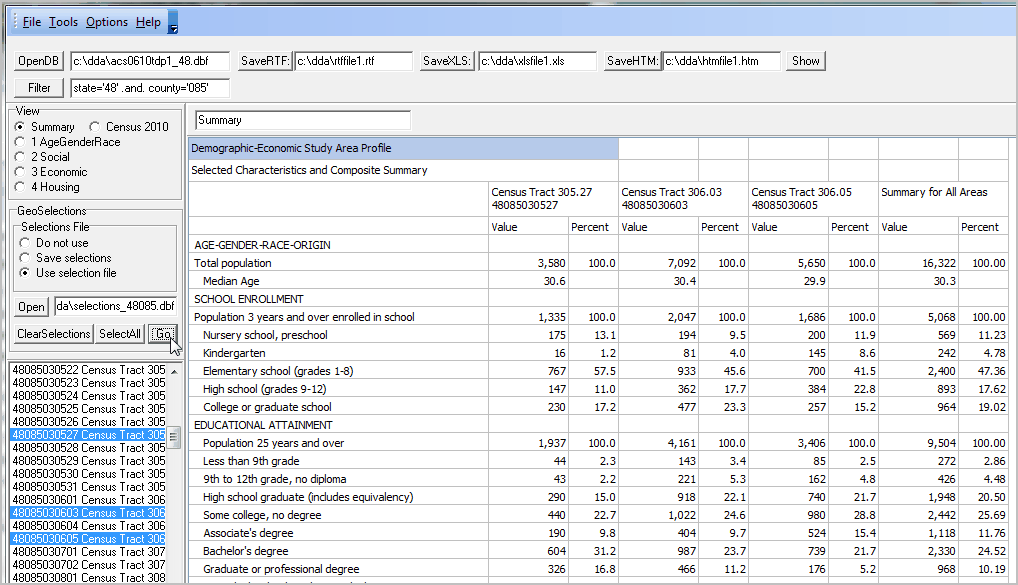
The following operations are shown in the graphic presented below.
The DB is set to c:\dda\acs0610tdp1_48.dbf (all Texas census tracts) and opened (click OpenDB).
A filter is applied (state='48' .and. county='085') and applied (click Filter).
A Selections file is used (created by CV) and Use selection file radiobutton is clicked.
The specific selections file c:\dda\selections_48085.dbf is opened.
The Go button is clicked; DDA generates six demographic profiles.
Part of the summary profile is shown in the grid.
The SaveHTM button was clicked to output/save all six profiles.
Click on links below next graphic to view each profile.
Six Demographic Profiles
HTML files created for three tract study area:
ACS 2010 & Census 2010 integrated items:
Summary/custom profile -- http://proximityone.com/dda/v48085030527s.htm
ACS 2010 Only
General Demographics - DP1 - http://proximityone.com/dda/v480850305271.htm
Social Characteristics - DP2 - http://proximityone.com/dda/v480850305272.htm
Economic Characteristics - DP3 - http://proximityone.com/dda/v480850305273.htm
Housing Characteristics - DP4 - http://proximityone.com/dda/v480850305274.htm
Census 2010 Only
Census 2010 General Demographics - http://proximityone.com/dda/v48085030527c.htm
Examining Patterns
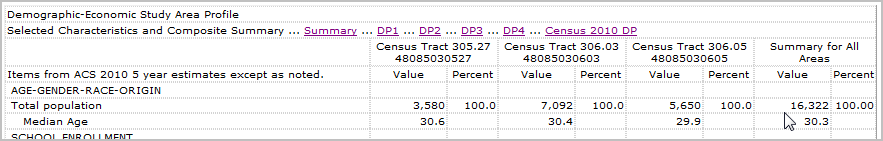
The following graphics were clipped from the http://proximityone.com/dda/v48085030527s.htm.
The next graphic shows data from ACS 2010 5 year estimates (centric to mid 2008).
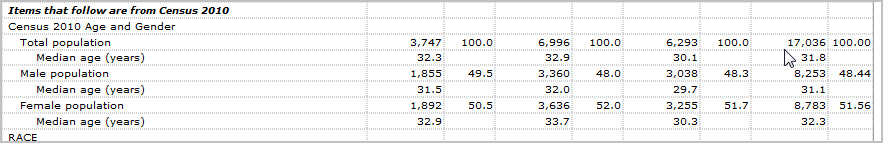
The second graphic shows data from Census 2010 (April 1, 2010).
Note that the sum of the population for the three tracts in 2008 was 16,322 compared to 17,036 in 2010.
The summary/custom profile shows data from ACS 2010 and Census 2010 as selected by the user.
(full view: http://proximityone.com/dda/htmfile_48085_s.htm)
See additional information about the content and use of these profiles and about census tracts.
