China Decision-Making Information
... role, scope and use
Decision-Making Information
Contact Proximity for information
resources and solutions ...
(888) DMI-SOLN
(888) 364-7656
. follow ProximityOne on Twitter
. watch Events of the Week
. subscribe to monthly DMINews
. more about ProximityOne
China's mid-year 2009 population is estimated to be 1.324 billion and projected to peak at 1.395 billion in 2026.
The median age is projected to increase from 34.7 years (2009) to 41 years (2026),
as the population 75 years and over grows from 41.2 million (2009) to 73.1 million (2026).
How will demographic change occur? Which cities/regions will grow most rapidly?
How will regional population composition be affected? This set of China-focused Web pages and related resources
illustrate use of analytical tools and geodemographics to help answer these types of questions.
Effective access to and use of decision-making information is critical to the success of planning
by business, governments and others.
This section will be expanded in January/February providing more detailed estimates and projections.
Using the China DMI Resources
Navigate China DMI resources using the links provided in the left panel.
China DMI ... this page
Select View: ... interactive Web maps with city links to show attributes
Beijing-Tianjin ... view focused on this area
Chongqing ... view focused on this area
Shanghai ... view focused on this area
All China ... view of all China
All China Larger View ... uses larger map panel for all China
CV GIS China Project ... CommunityViewer GIS applications
Cities Ranking Table ... China cities interactive ranking table
Initial focus of these resources is on China cities, provinces and urban/rural geodemographics.
The Web pages and related resources are an evolving resource/tool set.
Interactive map Web pages have been initially developed to illustrate use of
Google Maps API to view/analyze China city locations and demographic attributes.
CommunityViewer GIS applications contain the same data, expanded to include other data, and enable addition of your own data
as well as a much richer analytical capacity.
Urban/Rural Geographic Designations and Analysissee more
In comparison with the U.S., there is less known about the geodemographic characteristics of China cities and urban/rural patterns.
Whereas cities/places are well-defined places of population concentration in the U.S.,
cities in China are mainly adminstrative subdivisions of counties and provinces. China cities include variable amounts of rural areas.
China cities are more like towns to counties in comparing these geographies to U.S. counterparts.
In the U.S., cities are normally incorporated areas of population concentration with governmental authority granted by the corresponding
state. Towns and towhships are adminstrative subdivisions of counties without regard to population.
Some towns/townships may have near zero population. Towns/townships can be totally rural.
Conversely, there are many places of population concentration that are not incorporated and have no designated legal existence.
The mix of urban/rural geodemographics, and how the geodemographics are changing in a region, are very important to public and private sector planning and analysis.
There is presently little capacity to undertake these analyses in China.
China Designated Places.
China geodemographics are being expanded by Proximity to further the ability to analyze the urban/rural composition.
This process involves delineating "designated places" similar to the way that the
Census Bureau designates "census designated places" in the U.S.
Using CommunityViewer GIS, a geospatial analysis methodology is used to integrate satellite
imagery with vector-based geodemographic data to help define the China designated places.
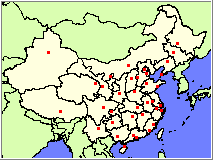
Use the interactive maps shown in these Web pages to access characteristics for China's largest cities.
The maps show city locations represented as red markers.
In many cases, the city name is also presented by the Google Maps API.
However, the Google Maps API does not provide a means to access attributes about the cities.
The power/utility added by the markers is the ability to access any URL-based resource that can be opened by a browser
including HTML pages, RTF/Word files, Excel files and many others.
Interactive Map Operations
Pan/drag map with the hand tool.
Use the - and + buttons to zoom-out and zoom-in. All Hawaii counties and all Hawaii public K-12 schools are included.
Mouse hover on a marker to view the school name.
Click a marker to view mini html table.
Click on a link in the mini html table to view a new Web page showing school characteristics.
Click the X by the mini html page to close it.
For each city, two links are provided. One link displays the data in Excel format; the other link displays the same data in HTML format.
About the Data and Development
City locations have been geocoded using the Proximity CommunityViewer GIS geocoder.
The CV Tools>Find Address (batch) feature has been used to create a city location point/marker shapefile and
corresponding XML file.
To create the interactive maps described above, the XML file is processed by the Proximity code interfacing access to the Google Maps API. The HTML pages
are initially designed to illustrate the process and will be expanded.
The shapefiles can be used with the CV GIS software (or any software with ability to process shapefiles)
and knitted together with other types of map layers/shapefiles (roads, market/trade areas, stores/any location(s), etc.)
Proximity develops geodemographic-economic data and analytical tools and helps organizations knit together and use diverse data in a decision-making and analytical framework. We develop custom demographic/economic estimates and projections, develop geographic and geocoded address files, and assist with impact and geospatial analyses.
Wide-ranging organizations use our tools (software, data, methodologies) to analyze their own data integrated with other data.