
|
|
|
.. mapping and analyzing county business patterns by type of business ... This section reviews use of tools and methods to develop custom U.S. by county business patterns data by type of business and develop mapping and related GIS applications. Steps illustrate how to develop a U.S. by county business patterns dataset for the supermarket industry -- NAICS type of business code 445100. Use the interactive table below to examine supermarket business characteristics by county. Create map views such as shown below and perform wide-ranging business patterns data analytics using the tools. Develop similar applications for any type of business - see full list of NAICS/type of business categories. Patterns of Supermarket Establishments by County The following graphic shows patterns of the number of supermarket estalishments by county for the Houston metro (bold boundary) region. Counties are labeled with the number of supermarkets and county name. Number of supermarkets shown by intervals/colors as depicted in legend panel at left of map window. Create custom maps similar to this view for your regions of interest depicting establishments, employment or payroll for your type of business selection(s). Click graphic for larger view with more detail; expand browser window for best quality view. 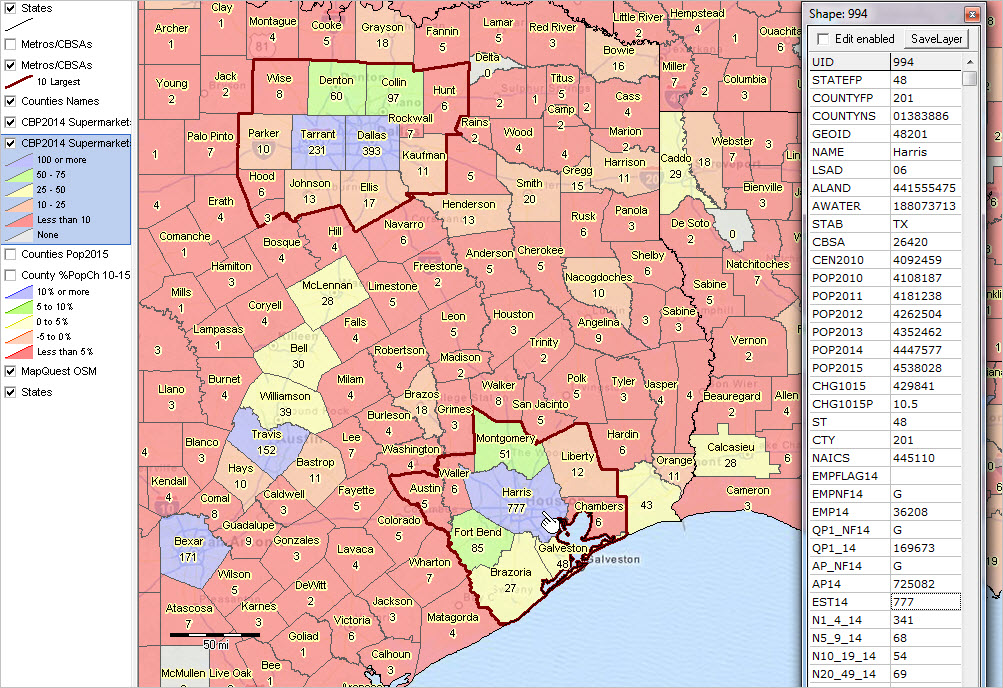 View developed with CV XE GIS software using the US1_CBP14 GIS project. NAICS Codes & Industry Titles Interactive Table Click ShowAll button between Find/Queries. Click column header cell to sort table on that column; click again to sort other direction. Use mouseover on column header to view column description. See usage notes below table. Usage Notes • Click ShowAll between queries/filters. • Click a column header to sort on that column; click again to sort other direction. • State button .. select a state to have the table refresh with rows for only that state. • Find-in-Name button .. enter a partial case-sensitive county name in the edit box to right of Find-in-Name button. .. click to Find-in-Name button to show only rows with that text in the county name (column 1). • Find-in-CBSA button .. enter an exact 5-character CBSA code in the edit box to right of Find-in-CBSA button. .. click to Find-in-CBSA button to show only rows with that text in the CBSA code (column 4). .. the default code 12060 is the Atlanta CBSA code. • Population 2014 Min & Max> button .. click to show only peer group counties based on values .. the ShowAll button must be clicked before using this feature. .. in min and max edit boxes ... ... enter the minimum 2014 population in the left edit box. ... enter the maximum 2014 population in the right edit box. .. click Population 2014 Min & Max button to view CHCs in peer group. • Click ShowAll between queries/filters. Support Using these Resources Learn more about demographic economic data and related analytical tools. Join us in the Data Analytics Lab sessions. There is no fee for these Web sessions. Each informal session is focused on a specific topic. The open structure also provides for Q&A and discussion of application issues of interest to participants. ProximityOne User Group Join the ProximityOne User Group to keep up-to-date with new developments relating to geographic-demographic-economic decision-making information resources. Receive updates and access to tools and resources available only to members. Use this form to join the User Group. Additional Information ProximityOne develops geographic-demographic-economic data and analytical tools and helps organizations knit together and use diverse data in a decision-making and analytical framework. We develop custom demographic/economic estimates and projections, develop geographic and geocoded address files, and assist with impact and geospatial analyses. Wide-ranging organizations use our software, data and methodologies to analyze their own data integrated with other data. Contact ProximityOne (888-364-7656) with questions about data covered in this section or to discuss custom estimates, projections or analyses for your areas of interest. |
|
|
