|
|
|
DMD Road Corridor Demographics
Road corridor demographics are demographics that are attributes of a road/street segment. A road/street segment is that section of the road/street between two intersections. There are more than 50 million road segments in the U.S. While it is more common to view/analyze small area demographics for geographic areas such as census blocks, block groups or census tracts, the focus here is on developing demographic attributes for the left and right side of individual road segments. Using road corridor demographics, the characteristics of chained/linked road segments, a pathway or corridor, can be analyzed. Since road segments have left- and right-side address ranges, road corridor demographics can be developed through the aggregation of address-oriented data located on a road of interest. The address data can be geocoded and carried as road corridor demographics. Examples would include customers, housing sales, or patient data. This section illustrates development of road corridor demographics using the Census Bureau TIGER/Line files in combination with the CV XE GIS API. The tools and methods described here are in production use. They may be applied to any county or higher-level geographic area in the U.S. The one-step batch application requires only a TIGER/Line edges, feature names and faces shapefiles. The CV XE API acquires the data via Internet and codes these demographics into the road corridor shapefile, created as the primary output of the process. TIGER/Line road segments have left- and right-side geocodes, such the census block, block group and census tract codes -- among many others as reviewed below. This makes it possible to develop road corridor demographics using, for example, Census 2010 Summary File 1 census block demographics and American Community Survey (ACS) block group (BG) demographics. The demonstration application is focused on Alexandria, Virginia. The yellow highlighted road segment in the map graphic is W. Braddock Road. The applications reviewed below are focused on this group of road segments -- but could be any other set of roads. View of Chained Segments; Selected Feature Name 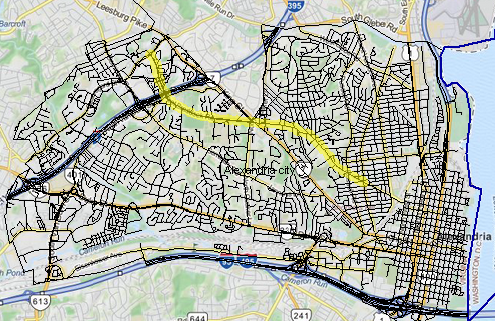
Zooming in, the further focus is on one specific road segment -- the 800 block of W. Braddock Road, shown at the location of the pointer in the next view. Census blocks are shown with blue boundaries and yellow labels. This segment has census block code on one side; census block code 4000 on the other. Block groups (BGs), groups of blocks, are shown with the orange bold boundaries and orange/white labels. This segment has BG code 2 on one side and 4 on the other (same census tract this case). Braddock Road itself still appears yellow as the query to locate/show is still active. Zoom-in View of Selected Segment 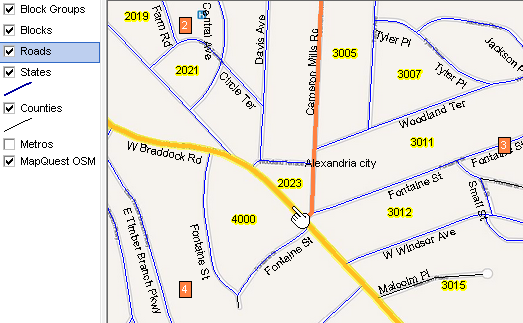
The TIGER/Line files are geography only; they do not contain demographic or similar subject matter data. Using the CV XE API, the TIGER/Line roads shapefile records are processed. A new roads file is developed that merges attributes of the TIGER/Line edges and faces shapefiles. As each record is developed, the API call returns selected Census 2010 census block demographics and ACS 2012 block group demographics that are inserted into the record. The profile of the 800 W. Braddock Road segment is shown below. Attributes of Selected Segment -- scroll section
Scroll down in the above scroll section to see attributes of the 800 block. The upper section is derived from the TIGER/Line edges shapefile. The lower sections are derived from the associated TIGER/Line faces shapefile. It can be seen that not only are the census block and block group identified on the right and left side, but a wide range of additional political (city/place, school district, congressional district, state legislative district, other) and statistical areas (census tract, CBSA, related metros, other). At the end of the left- and right-side sections are a selection of Census 2010 census block items (population and housing units) and American Community Survey 2012 block group items (population, housing units, median household income, median housing value). Any selection of Census 2010 Summary File 1 items and/or ACS 2012 summary file items could be added. Chained View of Segments The graphic presented below is a clip from the roads spreadsheet file that shows selected chained segments of W. Braddock Road that include the 800 block. These partial view records illustrate how records can be sorted on the left from address to examine demographics of the corridor in a tabular manner. In the present form the columns may be unreadable; click graphic for a larger view.alexrds3 Using these Resources The CV XE GIS software available to members of the ProximityOne User Group (join now, no fee) can create the basic corridor demographics shapefile for any county in the U.S. The resulting shapefile may be used with CV XE GIS to perform analyses and/or used with other GIS software. Roads Shapefile Table Attributes; Alexandria, VA -- Interactive Table Click ShowAll button between Find/Queries. Use mouseover on column header to view column description. See ranking table usage notes below ranking table. See related ranking tables -- http://proximityone.com/rankingtables.htm. Using the Interactive Table Chrome or FireFox browser recommended. • Click on a column header to sort on that column; click column header again to sort in other direction. • Click ShowAll button to show all schools and restore full set of data view. • Click State to select all schools in a selected state (click ShowAll between selections). • View additional rows/schools by sliding vertical scrollbar at table right. • Modify column width by dragging column separator in header row. • View additional columns by sliding horizontal scrollbar (leftmost columns remain fixed). Selected button with text queries; show schools/rows that meet search criteria: • Click ShowAll button first. • Find ZIP: filters for specified ZIP; key in text, click button. • Find StCty: filters for specified StateCounty FIPS code; key in text, click button. • Find DistID: filters for specified Federal school district ID; key in text, click button. For a particular query (view a "column set" -- create interchangable views): • All Columns: show all columns Additional Information ProximityOne develops geographic-demographic-economic data and analytical tools and helps organizations knit together and use diverse data in a decision-making and analytical framework. We develop custom demographic/economic estimates and projections, develop geographic and geocoded address files, and assist with impact and geospatial analyses. Wide-ranging organizations use our tools (software, data, methodologies) to analyze their own data integrated with other data. Follow ProximityOne on Twitter at www.twitter.com/proximityone. Contact ProximityOne (888-364-7656) with questions about data covered in this section or to discuss custom estimates, projections or analyses for your areas of interest. | ||||||||||||||||||||||||||||||||||||||||||||||||||||||||||||||||||||||||||||||||||||||||||||||||||||||||||||||||||||||||||||||||||||||||||||||||||||||||||||||||||||||||||||||||||||||||||||||||||||||||||||||||||||||||||||||||
|
|