

|
|
-- congressional community -- helping make your voice heard by policy-makers -- helping policy-makers better understand constituent/residents needs Knowing about the geographic, demographic, and economic characteristics of a congressional district and its congressional communities is essential to understanding where we are now, how things are changing and planning for the future. This section provides tools, data and methodologies to create these insights focused on Virginia Congressional District 11 (VA-11) and component communities, areas -- and how you can participate in making a difference now and in the future. The school age population (ages 5 to 17 years) in 2020 for VA-11 was 137,216 ( 17.5%) for CD118 VA111 compared to 1,404,934 ( 16.3%) for Virginia. This is one among many VA-11 to Virginia comparative analysis topics that you can examine here. Congressional District Communities Congressional district geographic, demographic, and economic characteristics typically vary widely by geographic subdivisions. So do needs and interests of geographic subdivisions represented by congressional communities. The 18 Congressional Communities within VA-11 focus on establishing ongoing dialogues with congressional leadership as well as Virginia state legislative district members and their staff, on action-oriented topics of interest. It is where we the constituents seek help on matters that relate to government operation. It is important to emphasize that the issues we focus on are generally matters affecting the community as a whole - ones of concern to each CC's participants, a group. Congressional Community 5111018 See the subsection below focused on Congressional Community 5111018. Mapping Congressional Districts & Communities .. using iVDA part of Visual Data Analytics .. more options available using VDAGIS Discovery What are characteristics of congressional districts and how are they changing. The start-up view is presented below in an interactive mapping window .. watch video Locate a CD or CC code .. see it on a map .. examine its demographics Click a box to view instructions. Find a Congressional District (CD) based on an address/location (zooms to CD).. enter ZIP ccde 85258 (or an address) in the searcbar.. the map view zooms-in to the CD containing the location and shows the CD crosshatched. .. view the demographic profile for this CD displayed in the lower left. .. here you can examine many demographic subject matter items for that CD. .. optionally click on other layers in the Legend Panel. .. Try a different address or location .. the view will zoom to that CD. Find a Congressional Community (CC) based on an address/location (zooms to CC)
.. in the legend panel at left, click on the layer name for "Cong Community Code". It turns blue .. the active layer... enter an address "33606 N. 60th Street, Scottsdale, AZ 85266" (no quotes, not case sensitive) .. the map view zooms-in to the CC containing the location and shows the CC crosshatched. .. view the demographic profile for this CC displayed in the lower left. .. here you can examine many demographic subject matter items for that CC. .. optionally click on other layers in the Legend Panel. .. the address/location is shown by the blue marker .. this is the CC associated with the address/location used in the searchbar. .. see that the CC code is 0401017. .. see in the lower left panel the Census 2020 population was 43,515 for this CC. .. compare CC 0401017 with CD 0401 .. Try a different address or location .. the view will zoom to that CC.. Examine Urban/Rural Patterns.. in the Legend Panel, left of map, click "Urban Layers" ckeckbox on... click on an Urban Area in map to view its attributes in lower left panel. .. hide this layer by unchecking the layer checkbox. Examine Patterns of Economic Prosperity by Neighborhood/Census Tract.. in the Legend Panel, left of map, click "Tracts $MHI" ckeckbox on (scroll down)... click on an Urban Area in map to view its attributes in lower left panel. .. hide this layer by unchecking the layer checkbox. Virginia VA-11 Congressional Communities .. goto top ..CD VA-11 shown with bold brown boundary .. CCs shown with bolder black boundary and 7-character code .. counties shown with lighter black boundary 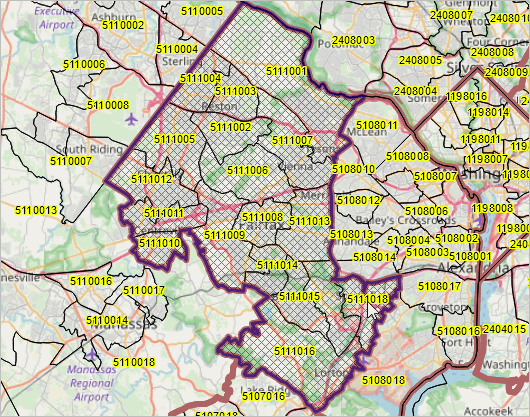 • Click here to start using CC-CD interactive mapping Characteristics of CD VA-11 CCs .. goto top To see a concrete example of the benefit of the Congressional Communities model, compare the information about the district against that of the CCs. The table below shows some aspects of how CC demographics differ. .. the blue highlighted row shows the overall district; other rows show its component Congressional Communities .. see that the diversity (4th column) ranges from 55.6 to 79.4. .. see that the percent Hispanic (7th column - Pct Hispanic) ranges from 6.8 to 30.2. .. most or the district is urban. .. Other areas we can explore at the district at the CC level, particularly when the CC becomes fully active: - examining access to healthcare resources in your CC - how can your CC have a voice on the SNAP, housing issues, transportation, others - how do these topics vary from CC to CC? The following static graphic is from the full national scope interactive table. 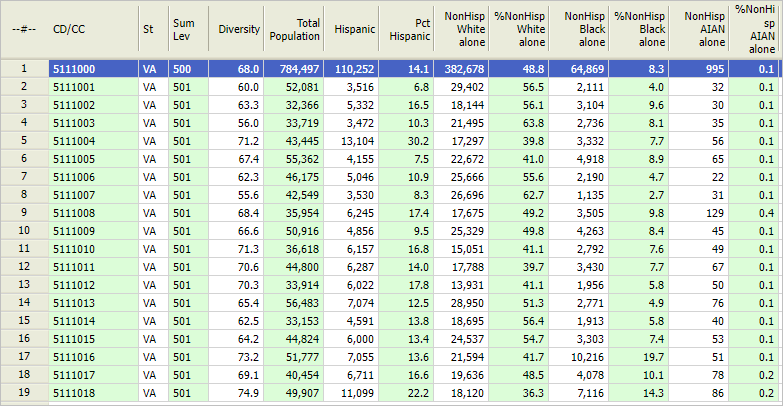 Comparative Demographic Analyses of VA-11 Congressional Communities with CD VA-11 .. goto top CCs nest within CDs, exhausting the CD land/water area. These reports provide a comparative analysis of demographic characteristics of a CC relative to its CD. Using the Demographic Analysis (DA) compare your CC with other CCs of CD. These are both HTML documents designed to optionally print to 8.5" x 11" dimensions. The tabular looks more like a spreadsheet while the narrative report provides a comparation more in a flowing narrative and adds contextual detail. VA CD 11 Congressional Communities Demographic Profiles .. click a CC or interest • VA-11 CC 001 .. examine how the dependency ratio differs among CCs. • VA-11 CC 002 • VA-11 CC 003 • VA-11 CC 004 • VA-11 CC 005 • VA-11 CC 006 • VA-11 CC 007 • VA-11 CC 008 • VA-11 CC 009 • VA-11 CC 010 • VA-11 CC 011 • VA-11 CC 012 • VA-11 CC 013 • VA-11 CC 014 • VA-11 CC 015 • VA-11 CC 016 • VA-11 CC 017 • VA-11 CC 018 About Congressional Districts .. goto top The U.S. 435 118th Congressional Districts (Jan 3, 2023 to Jan 3, 2025) have an average population of approximately 763,000 population, larger than three states. See related 118th CD demographics interactive table. Patterns of Virginia Population Change 2020-2023 by County .. goto top Benefit from tools and data provided through the Congressional Community organization to understand demographic change. 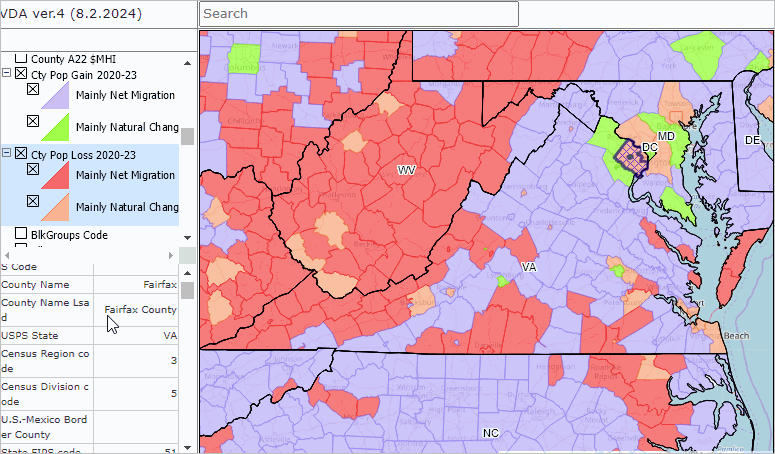 Congressional Communities .. goto top The Congressional Communities program is an initiative of the nonprofit Congressional Communities organization. As a resident, constituent, of a congressional district, how do you make your voice heard on key issues affecting you, your household and your local living environment in Congress? Congressional Communities, subdivisions of Congressional Districts, can help Americans better have their voice heard by Congress. Congressional communities are developed by assembling 2020 census blocks and block groups by the Congressional Communities team. Congressional districts are sub-divided into CCs, sets of contiguous blocks/block groups, that are typically around 40,000 population based on a range of socioeconomic, geopolitical features, geographic and other factors. A set of Census 2020 and American Community Survey demographics are developed for each CC. These demographics help CC stakeholders better understand characteristics and needs of their CCs and other CCs. The sum of the total population (and other demographic attributes) for all CCs nesting in a CD equals the CD total population. The CD demographics are the aggregates of the associated CCs, yet the CCs have their own unique characteristics. Unlike census tracts, averaging 4,000 population, CCs nest within CDs and better reflect neighborhood-plus characteristics. Unlike cities, CCs include rural and suburban areas and sub-divide larger cities. Congressional Community 5111018 . goto top This sub-section is focused on Congressional Community 5111018. The following view, developed using the iVDA tool above, shows a drill-down view of CC 5111108 (cross-hatched). This view shows block groups labeled with Citizen Voting Age Population (CVAP). 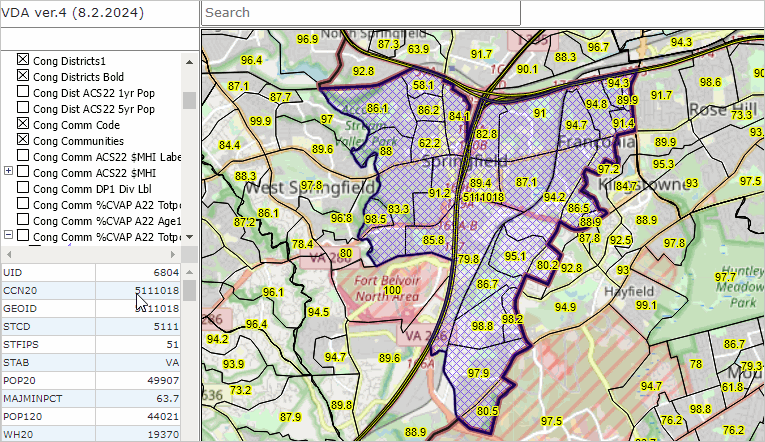 The next graphic shows a similar view but a thematic map showing CVAP by block group. See color-value intervals in the legend panel at left. 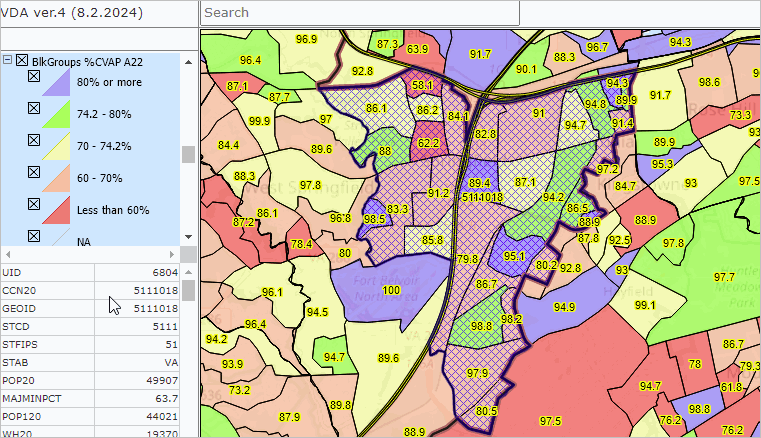 Our Issues . goto top "Our issues" are established by individuals participating in individual CCs. Issues are topics that are raised in the zoom meeting. An opening issue for many VA CD 11 CCs might be the SNAP funding or housing. Our Collaborations . goto top "Our collaborations" are mainly zoom meetings that revolve around "Our issues". Participation. goto top Participation is open to individuals, normally a resident of that CC. There are no fees. Click here to sign-up and participate in the Congressional Communities program. Benefits & Resources . goto top under development Support Using these Resources .. goto top Learn more about accessing and using demographic-economic data and related analytical tools to meet the mission of indiviual CCs. Join us in a web session. There is no fee or registration. Each informal session is focused on a specific topic. The open structure also provides for Q&A and discussion of application issues of interest to participants. |
|
|