

|
|
-- create, modify, manage, view, merge dBase files Why and how can you analyze the quarterly level and change in establishments, employment and wages by detailed type of business by county? dBTools enables you to organize these data for analysis and put them into a Geographic Information System (GIS). Use of these data are at the core of gaining insights into how and where the economy is changing. These important, powerful, unique data are published quarterly by the Bureau of Labor Statistics (QCEW data) in CSV structure. The data have to be transformed into another format before they can be used for geospatial analysis. This can be done using dBTools. The BLS QCEW data are one example of where dBTools provides an important capability. See more about using the QCEW data below with dBTools. Integrating and managing data files, knitting together disparate datasets based on a common key, can be a challenging obstacle to easy and effective data use. dBTools is a Windows-based program that can be used to create, modify, manage, view, merge dBase files. See terms of use. dBTools is a generalized dBase/dbf data management software tool. While this section is focused on its use and applications that relate to geostatistical data, it can be used to manage, organize, integrate and analyze many other types of data. dBTools can be used to import, process and export data organized as CSV, DBF, Excel and other data file structures. It does not use proprietary data structures. Designed as a companion to the ProximityOne CV XE GIS software (see more about GIS), dBTools does not included mapping operations itself. Using dBTools with TIGER Digital Map Database Use dBtools to integrate/merge subject matter data from American Community Survey, decennial census and data files developed using the Demographic-Economic Data Explorer (DEDE), and a vast array of other data resources into Census Bureau TIGER digital map database shapefiles. Get your thematic mapping and geospatial analysis applications underway more flexibly. dBTools may be used with any dBase file. The dBase files do not need to be associated with mapping, GIS or shapefiles. dBTools Availability dBTools is available at no fee to members of the ProximityOne User Group and intended to support DEDE, CV XE GIS, VDAGIS and VDA Web GIS applications. VDAGIS and VDA Web GIS have been developed and are supported/maintained by Warren Glimpse/ProximityOne/Alexandria, VA USA and Takashi Hamilton/Tsukasa/Osaka, Japan. All that is required to use VDA Web is a Web browser. iOS and Android versions are supported. VDAGIS and VDA Web GIS use the same core GIS project structures. dBTools Installer dBTools operates on most any Windows computer. To install dBTools, follow these steps: • Run the dBtools installer. • Your ProximityOne User Group ID is required; join here, check join User Group, there is no fee. • Take all defaults when prompted. dBTtools Start-up & Operation The dBTools start-up view is shown below. 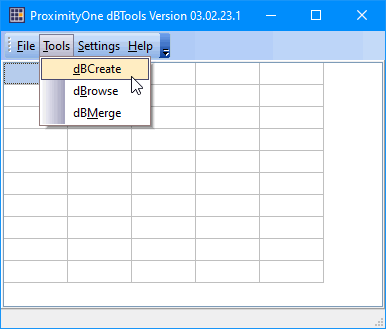 Examples and Tutorial .. goto top Analyzing HUD Qualified Census Tracts Focus on Housing and Urban Development (HUD) Qualified Census Tracts QCT Criteria: Low-Income Housing Tax Credit Qualified Census Tracts must have 50 percent of households with incomes below 60 percent of the Area Median Gross Income (AMGI) or have a poverty rate of 25 percent or more. Role: Low-income housing tax credit may apply to properties located in QCT areas. and increase credits for up to 30% for new construction and rehabilitation. QCTs are of interest to developers, governments and other stakeholder organizations. The HUD QCT data can be downloaded here .. in CSV structure .. common for Federal geostatistical data. Step 1 .. download the CSV file "2023 Qualified Census Tracts - Geocoded dBase File (QCT2023CSV.zip)" .. save this zip file to c:\dbtools and expand the zip file to that folder. The QCT2023.csv file (downloaded above) will be converted to a DBF file so that it can be merged into the TIGER tracts shapefile. Step 2 With dBTools running, the QCT2023.dbf file structure is created using Tools>dBCreate feature. Based on the following HUD provided metadata: Variable Name Variable Description cbsa .. MSA (Metro CBSA) Code, set at 10,000 x State FIPS Code for nonmetro counties statefp .. STATE FIPS code cnty .. COUNTY FIPS Code stcnty .. Combined STATE and COUNTY FIPS codes tract .. TRACT code as number with specified decimal splittr .. Indicates 2020 Census tract split by New England HMFA boundaries, 1 = split qct_id .. UNIQUE IDENTIFIER: State, County, tract FIPS codes with 1 digit split indicator fips .. State, County, tract FIPS codes for match with Census Data Sources Create this dbf structure: 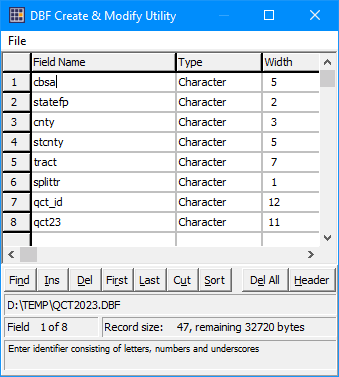 Save this file as c:\dbtools\QCT2023.dbf. This is the file structure; the CSV structured file is now imported. Step 3 With dBTools running, the QCT2023.dbf file structure is opened using the Tools>dBrowse feature. .. open the c:\dbtools\QCT2023.dbf file. .. use the Import button below the table to import the QCT2023.csv file. 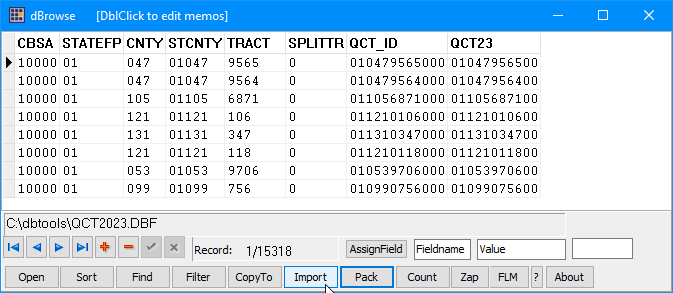 We are now ready to merge the c:\dbtools\QCT2023.dbf into the tracts shapefile. Step 4 The Census Bureau TIGER Census 2020 TIGER shapefile is needed for the next step. 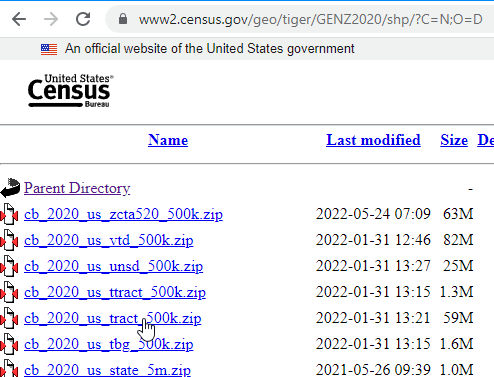 .. The generalized Census 2020 all U.S. tracts file is downloaded and expanded into c:\dbtools folder. .. download the TIGER ZIP file Step 5 Merge the QCT2023.dbf file with/into the cb_2020_us_tract_500k.dbf With dBTools running, one field from the QCT2023.dbf is merged into the tracts shapefile dbf using Tools>dBMerge feature. 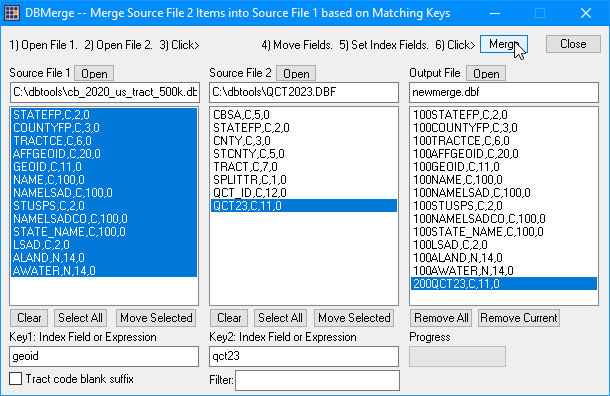 .. click the Merge button to strat the process. When prompted about overwrite, reply yes. .. this process willl require ~ 3 minutes; the form closes when done. Step 6 View the merged cb_2020_us_tract_500k.dbf file. With dBTools running, the tracts shapefile dbf is viewed/examined using Tools>dBrowse feature. In the following graphic, the rightmost field is the merged field. .. a query/filer was placed on the grid substr(qct23,1,1)<>' ' to show only QCT 2023 tracts. .. the count button was then used to determine how many of the ~85,000 tracts are QCT 2023 are qualified.  .. click graphic for larger view. The shapefile is now ready for use with any GIS software that can process a shapefile. Dallas Area Using VDA GIS .. use the Neighborhoods project to view/analyze QCTs in context of other geography and attributes. .. graphic below shows Dallas area QCTs (salmon fill pattern and tract code label with a ZIP Code (ZCTA) overlay (blue bold boundary white boxed label). .. pointer located in tract 48113020500 and ZCTA 75212. 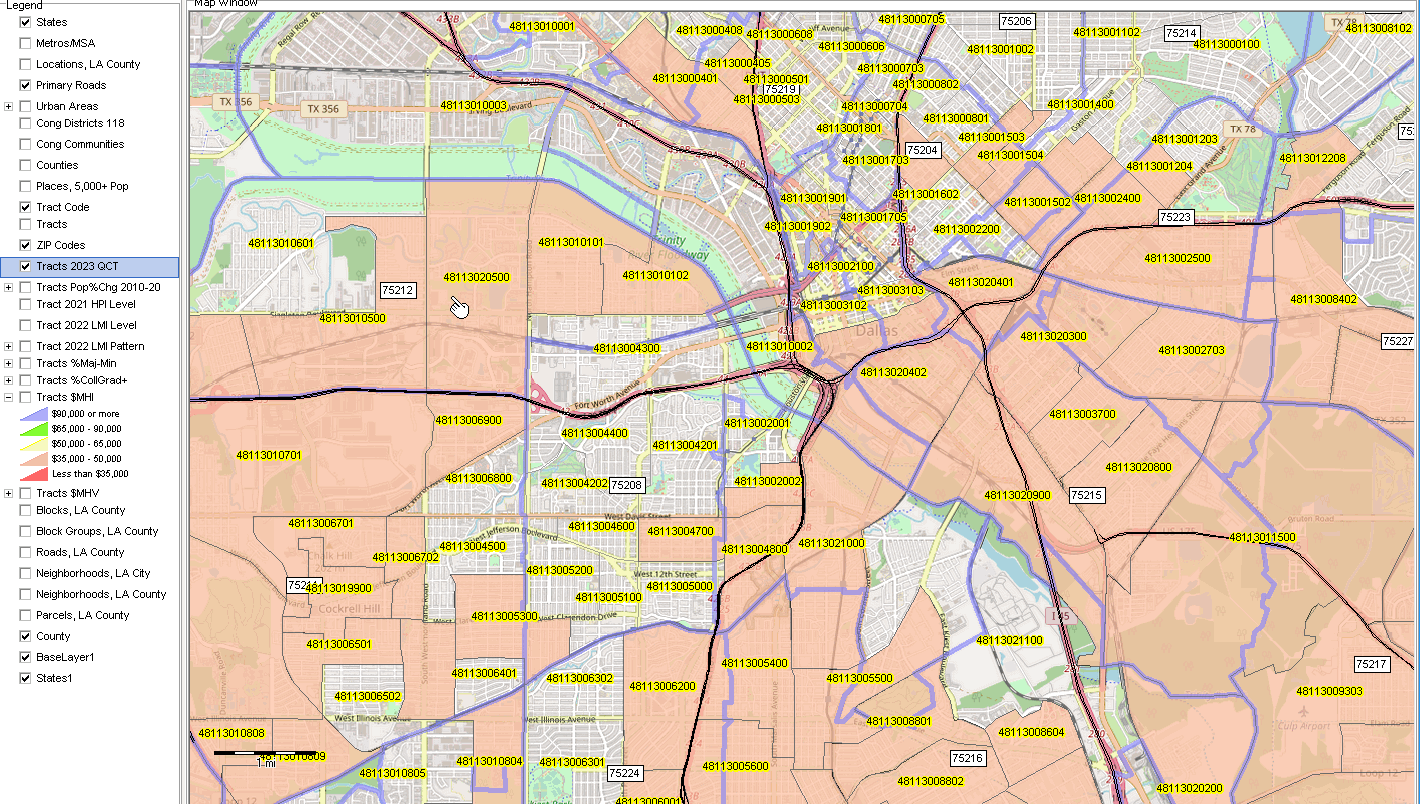 .. click graphic for larger view Quarterly Census of Employment and Wages (QCEW) .. goto top What are these data and what is their role What DEDE does compared to the role of dBTools with respect to the QCEW data. dBrowse view of 2022Q3 data  .. click graphic for larger view Scope of subject matter .. fields area_fips own_code industry_code agglvl_code size_code year qtr disclosure_code qtrly_estabs month1_emplvl month2_emplvl month3_emplvl total_qtrly_wages taxable_qtrly_wages qtrly_contributions avg_wkly_wage 2020, 2021, 2022 datasets already created Objective: develop a map of the percent manufacturing establishments by county using QCEW 2022Q3 data. Step 1. Install dBTools if not already installed. • Run the dBtools installer. • Your ProximityOne User Group ID is required; join here, check join User Group, there is no fee. • Take all defaults when prompted. Step 2. Get the U.S. by county shapefile. 2.1. Download form here: https://www2.census.gov/geo/tiger/GENZ2021/shp/cb_2021_us_county_500k.zip 2.2. Expand the zip file to your dBTools folder. Step 3. Download the QCEW 2022Q3 CSV file. 3.1. Open the QCEW Download data files page 3.2. Click the 2022 link by pointer as illustrated in this graphic:  .. click graphic for larger view. 3.3. Expand the zip file to your dBTools folder. Step 4. Create the QCEW 2022Q3 dbf dataset. 4.1. With dBTools running, click Tools>dBrowse. 4.2. Click the Open button on the dBrowse form (lower left). 4.3. Select the file "QCEWSTRUC.DBF" located in your dBTools folder. 4.4. Click the ZAP button below the grid to insure the file is empty. 4.5. Click the Import button below the grid. Select the CSV option. 4.6. Select the file downloaded as Step 3.3. above. 4.7. Wait for the progress bar to complete processing. 4.8. Click the Export button below the grid and save the file ___ to the dBTools folder The QCEW dbf is now ready to merge with the shapefile referenced in 2.2. above Close the dBrowse form. Step 5. Merge the QCEW 2022Q3 dbf into the U.S. by county shapefile. 5.1. With dBTools running, click Tools>dBMerge. in the dBMerge form: 5.2. Open the county shapefile dbf as Source file 1. 5.3. for Source file 1, click Select All, then click Move Selected/ 5.4. for source file 1, 5.3. Open the QCEW dbf as Source file 2. 5.4 Apply this query: owncode='5' .and. qtr='3' .and. agglvl='74' .and. naics='31-33' owncode='5' .and. qtr='3' .and. agglvl='71' 6. Add the Integrated County Shapefile to a GIS Project 7. Create a Pattern Map -- Percent manufacturing establishments by county Terms of use .. goto top dBTools is available for the exclusive use of the ProximityOne User Group members. dBTools may not be redistributed. There are no warranties for any aspect of dBTools. Support Using these Resources .. goto top Learn more about demographic economic data and related analytical tools. Join us in a Decision-Making Information Web session. There is no fee for these one-hour Web sessions. Each informal session is focused on a specific topic. The open structure also provides for Q&A and discussion of application issues of interest to participants. ProximityOne User Group Join the ProximityOne User Group to keep up-to-date with new developments relating to geographic-demographic-economic decision-making information resources. Receive updates and access to tools and resources available only to members. Use this form to join the User Group. There is no fee. Additional Information ProximityOne develops geographic-demographic-economic data and analytical tools and helps organizations knit together and use diverse data in a decision-making and analytical framework. We develop custom demographic/economic estimates and projections, develop geographic and geocoded address files, and assist with impact and geospatial analyses. Wide-ranging organizations use our tools (software, data, methodologies) to analyze their own data integrated with other data. Follow ProximityOne on Twitter at www.twitter.com/proximityone. Contact ProximityOne (888-364-7656) with questions about data covered in this section or to discuss custom estimates, projections or analyses for your areas of interest. |
|
|