
|
|
|
A heatmap in Geographic Information Systems (GIS) is a data visualization technique that uses color to represent the density of geographic phenomena. By displaying varying color intensities, from "cool" (low density) to "hot" (high density), heatmaps effectively illustrate the concentration of points or events within a given area. This allows for the easy identification of clusters and patterns that might not be apparent from looking at individual data points on a map. The term heatmap is more of a generic term, there being variations of heatmaps and the way they are computed and rendered. Variations of Heatmaps and Related Spatial Analysis Techniques IDW (Inverse Distance Weighting) and heatmaps are both spatial analysis techniques used in GIS, but they serve different purposes and operate on different principles. Heatmaps Purpose: Heatmaps visualize the density or concentration of points or events across a geographic area. Method: They create a continuous surface representing the density of points, typically using a kernel density estimation method. The 'heat' or color intensity on the map indicates areas of higher density. Applications: Heatmaps are excellent for identifying spatial patterns, clustering, and hotspots of phenomena like population, crime incidents, traffic accidents, or disease outbreaks. IDW (Inverse Distance Weighting) Purpose: IDW is an interpolation technique that estimates unknown values at unsampled locations based on known values at surrounding sample points. Method: It uses a weighted average, where the weight assigned to each sample point is inversely proportional to its distance from the location being estimated. Closer points have a greater influence on the estimated value. Applications: IDW is used to create continuous surfaces representing attributes like temperature, elevation, or rainfall, allowing for estimations at unmeasured locations. Using VDA GIS Projects Heatmaps may be generated using any of the VDA GIS tools and projects. • VDA Desktop -- most powerful, Windows based. • iVDA -- embedded version of VDAW4, web-based, nothing to install -- soon • VDAW4 -- web-based, nothing to install -- soon VDA GIS Desktop to Develop Heatmaps -- Order now • VDA GIS Desktop with default GIS Project .. 1-year license .. about Illustrative Heatmap Operation and Views Suppose you want to see the location of more recently developed housing units (units built since 2020). The following view illustrates starting the IDW version with VDAD and the 119th Congressional Districts/Congressional Communities GIS Project • Heatmap is started using Tools>Heatmap which brings up this form. • In this application, the user chooses the IDW heatmap, layer CD119 ACS231 DP4 Housing (CD119 ACS 20231 Housing), and item H017 Built 2020 or later. 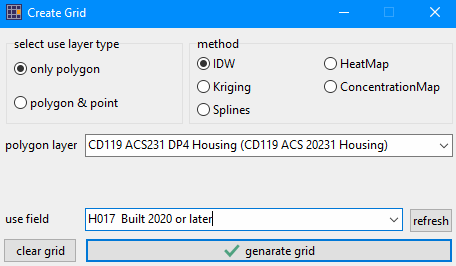 Ramp colors may be set in the SetOptions features. This enables different colors and shades of blues and reds as used in these examples. The following heatmap is generated 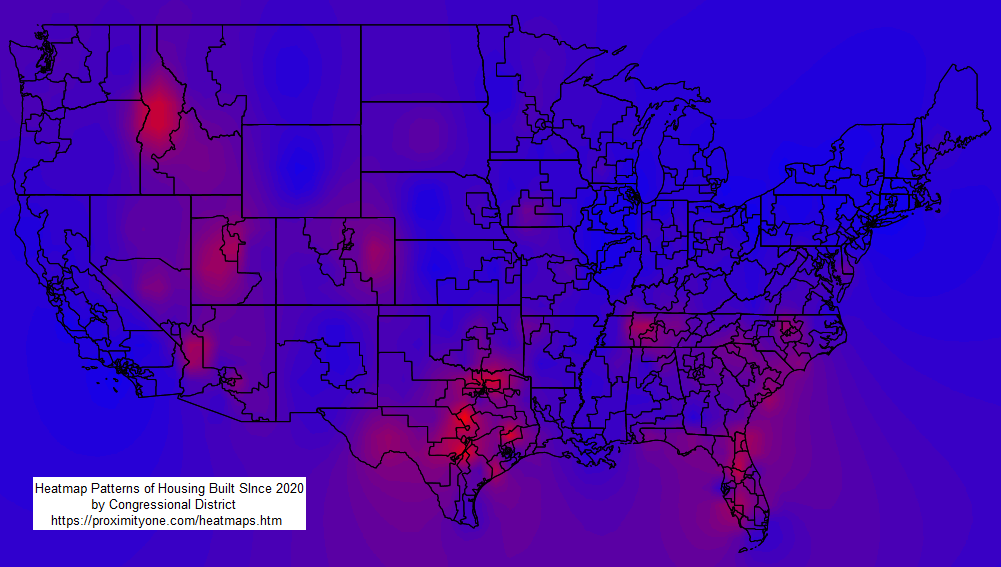 The user may optionally show labels (H017 Built 2020 or later) 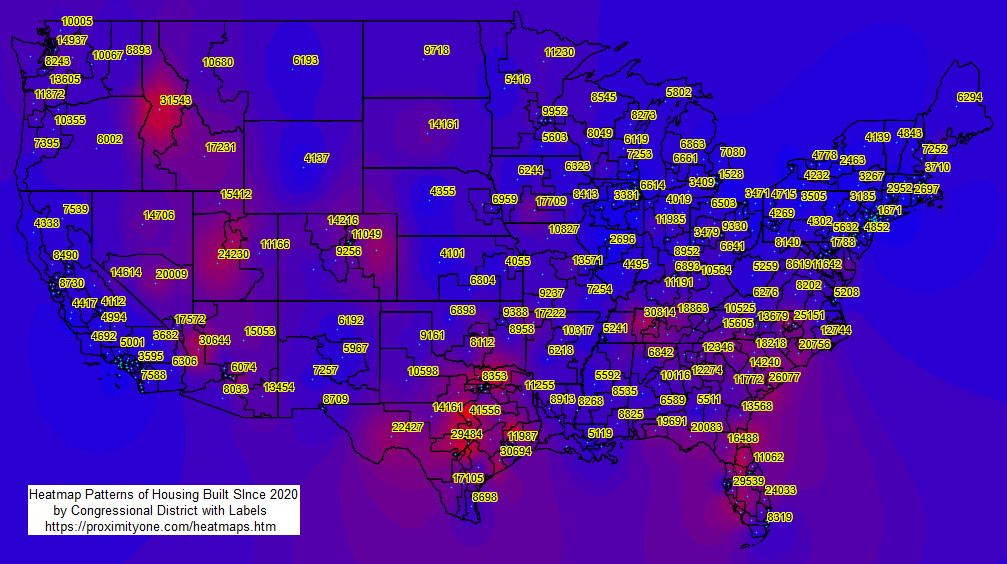 Zoom-in to Phoenix, AZ MSA by Congressional Community In this application, the user chooses the IDW heatmap, layer CC119 ACS235 Itemset1 (CC119 ACS 20235 Housing), and item H017 Built 2020 or later. an alternative view of item H017 by square mile would provide better insights. 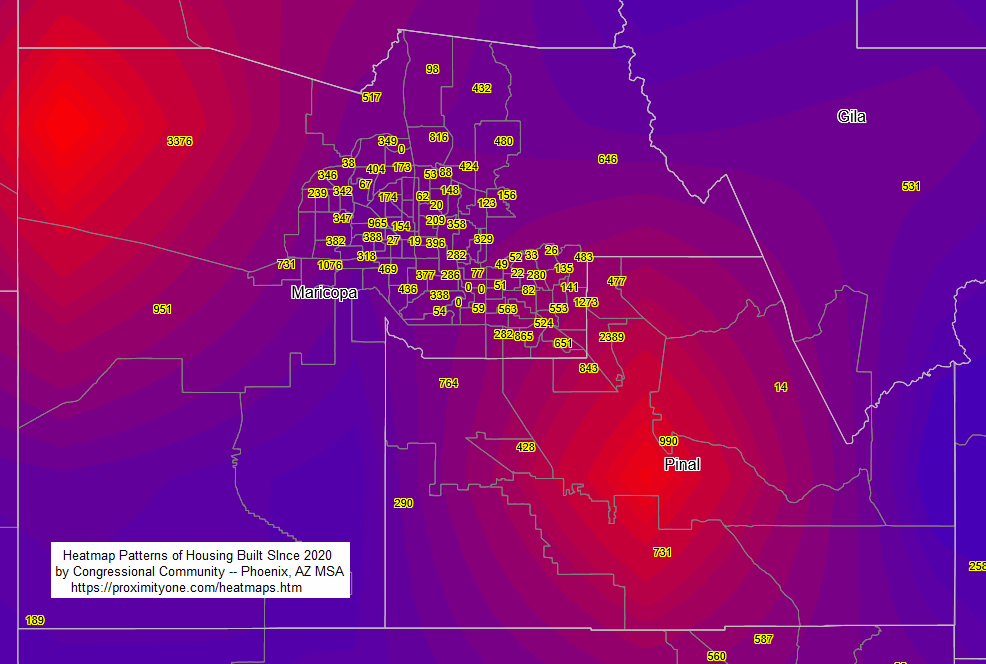 Key differences of IDW versus Heatmaps Data Type: Heatmaps primarily work with point data representing discrete events or locations. IDW, on the other hand, interpolates continuous attribute values associated with sampled locations. Output: Heatmaps highlight areas of high density or concentration. IDW generates a surface of estimated attribute values across the entire study area. Underlying Principle: Heatmaps use density estimation, emphasizing the clustering of features. IDW relies on the principle of spatial autocorrelation (closer values are more related) to estimate values at unmeasured points. Choosing between IDW and Heatmaps Choose a heatmap when you want to visualize the spatial distribution and density of points or events. Choose IDW when you need to estimate and visualize the values of a continuous variable across a region based on known sample points. It is important to note that while they serve different purposes, both IDW and heatmaps are valuable tools for spatial analysis and visualization in GIS, allowing us to gain insights into spatial patterns and relationships within geographic data. About VDA GIS Tools .. goto top iVDA is an HTML iframe embedded version of VDA Web GIS. VDAGIS tools and data have been developed and are updated/supported by Warren Glimpse/ProximityOne/Alexandria, VA USA and Takashi Hamilton/Tsukasa/Osaka, Japan. Support Using these Resources .. goto top Learn more about census tract demographic economic data and related analytical tools. Join us in a Data Analytics Lab session. There is no fee for these informal sessions focused on your interests. The open structure provides for Q&A and discussion of application issues of interest to participants. Terms of Use .. goto top There is no warranty regarding any aspect of this using this project. The user is solely responsible for any use made of iVDA or data contained in project files. Contact ProximityOne (888-364-7656) with questions about data covered in this section or to discuss custom estimates, projections or analyses for your areas of interest. |
|
|