
|
|
|
Analyzing Business Patterns -- ZIP Code & County Patterns by Detailed Type of Business
May 2015 ... Harris County, TX (Houston) gained 1,658 business establishments between 2012 and 2013. How did the number and characteristics of business establishments in your counties or region of interest change? These data are available by county (and ZIP code) and can be used to determine which counties (ZIP codes) are experiencing business growth or decline and by how much. These data are based on a annual count of business establishments by physical location that have at least one paid employee. A single company may have multiple business establishments. Attributes of individual establishments, including payroll and employment, are summarized/aggregated by county and ZIP code area. The establishment data are also summarized by the NAICS type of business code. What's happening next year? Are these data too old? See more about these data and options. Examine a specific industry such as construction. Among all counties, Harris County, TX had the highest 2013 employment in the construction industry (see more below). Where do your counties/ZIP code areas rank (in this or any other industry)? The following views illustrate how Geographic Information System (GIS) tools can be used to visually examine change in business patterns. Use the CV XE GIS and associated GIS project to examine establishments, payroll and employment by detailed type of business. These applications shown change for one year; choose a different set of years. Integrate your own data such as market territories or customer/prospect data to examine how business opportunities match up with existing and changing patterns. Change in Business Establishments, 2012-2013 -- Texas by County The following graphic shows the change in the number of business establishments by county in Texas and adjacent areas. Metros are shown with bold black outlines. Color patterns show change in the number of establishments between 2012 and 2013. It is easy to see which counties have business establishment growth (blue/green) or decline (orange/red). Use the GIS resources to develop similar business patterns views for any state/area in the U.S. The legend at left of map (click graphic for larger view with legend) shows establishment change intervals by color. 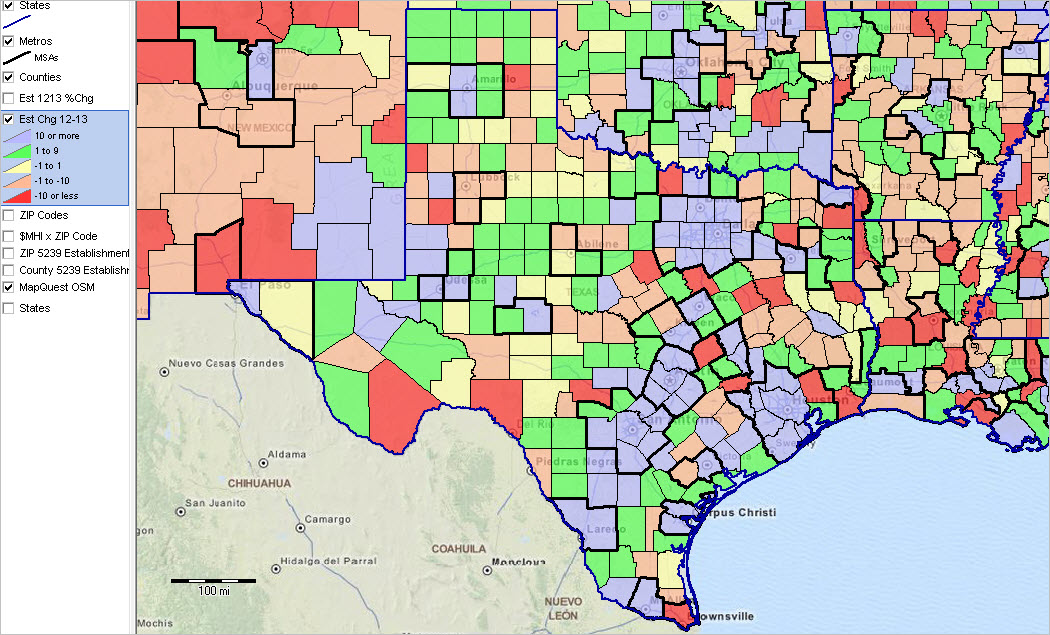 -- view created using CV XE GIS and associated GIS Project -- click graphic for larger view showing details. Change in Business Establishments, 2012-2013 -- Houston Area by County The following graphic shows the change in the number of business establishments by county with a zoom-in view of the Houston area. Use the GIS resources to zoom in to any county/region of the U.S. The legend at left of map (click graphic for larger view with legend) shows establishment change intervals by color. Counties are labeled with county name and percent change in the number of establishments between 2012 and 2013. 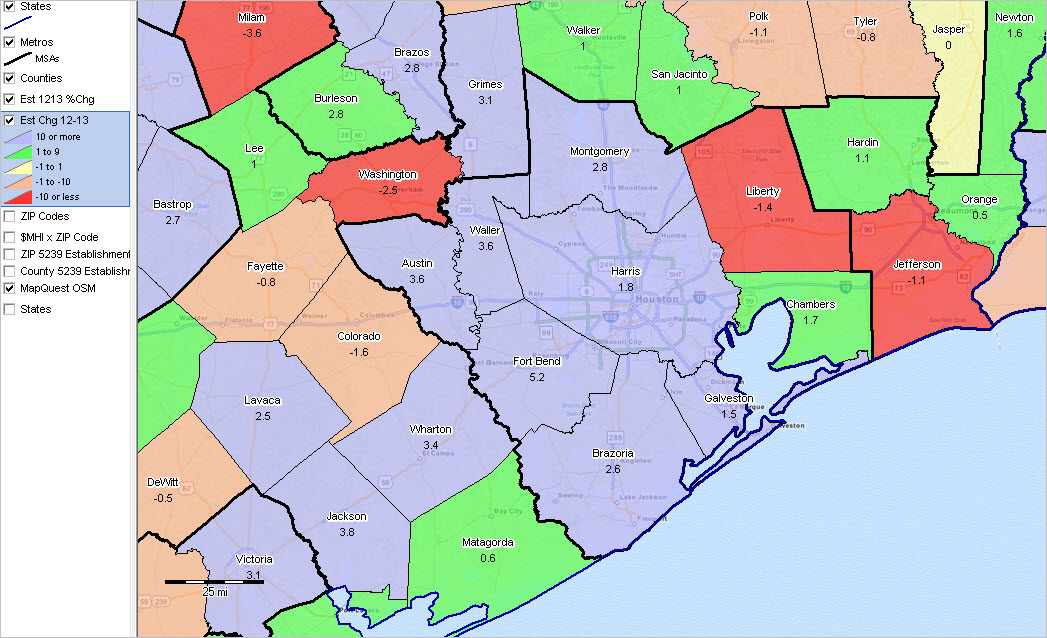 -- view created using CV XE GIS and associated GIS Project -- click graphic for larger view showing details. Profile of County Business Establishment Change The following table shows a basic overview of the change. There is much more detail available. The GIS project enables mixing demographic with economic and business data.
Database Query: Counties with Highest Employment in Construction Industry Consider a requirement to determine the list of 10 counties having the highest employment in the construction industry. The 2.1 million record database with county by type of business is opened with the CV XE GIS dBrowse operation/feature. Note that this database size exceeds the Excel limit. A query is placed on the database to show on NAICS (type of business) code "23----" having number of 2013 employment of 10,000 or more. The query could have been any NAICS code in combination with another attribute or none. The table is then sorted in descending order on 2013 employment (by clicking the sort button). The resulting records/counties are displayed as shown. The county FIPS code 201 in state FIPS code 48 (Harris County) has the highest total construction industry employment in the U.S. It is easy to see the other top 10 (or some group) that are also highly ranked. The Count operation is used to shown how many counties meet this criteria; there are 118. Other selected attributes are shown in the table/graphic. This selection could optionally be exported to a file in a different format (e.g., CSV). 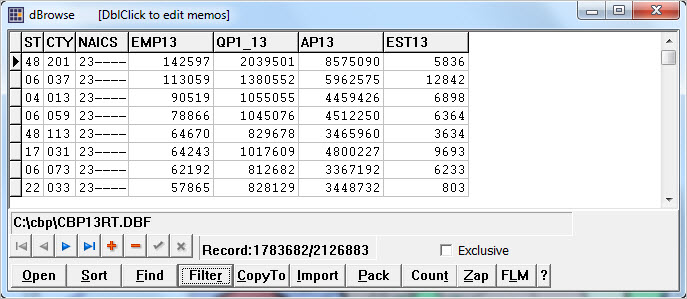 Business Patterns Data The business patterns data reviewed in this section are extracted from the Business Register (BR), a database of all known single and multi-establishment employer companies maintained and updated by the Census Bureau. The BR contains the most complete, current, and consistent data for business establishments. The annual Company Organization Survey provides individual establishment data for multi-establishment companies. Data for single-establishment companies are obtained from various programs, such as the Economic Census, Annual Survey of Manufactures and Current Business Surveys, as well as from administrative record sources. The data are updated annually. There is an approximate lag of 18 months between the data reference period and the data access date. Age of the Data. As of May 2015, the most current data available from the Census Business Register/Company Organization Survey are for 2013. The only other comparable Federal statistical data are from the BLS Quarterly Census of Employment and Wages (QCEW). The QCEW data 1) are available U.S. national scope by county (not ZIP Code) and 2) include number of establishments, employment and payroll by 6-digit NAICS type of business. Not only are the QCEW data available on a quarterly basis, they are more recent (as of May 2015, the 3rd quarter 2014 data). ProximityOne uses augmented QCEW data to develop current estimates and projections. See more about the current estimates and projections data. Establishments. An establishment is a single physical location at which business is conducted or services or industrial operations are performed. An establishment is not necessarily equivalent to a company or enterprise, which may consist of one or more establishments. A single-unit company owns or operates only one establishment. A multi-unit company owns or operates two or more establishments. The treatment of establishments on the Business Register differs according to whether the establishment is part of a single-unit or multi-unit company. Coverage excludes data on self-employed individuals, employees of private households, railroad employees, agricultural production employees and most government employees. County and ZIP Code area business pattern data are updated annually. 2013 business pattern data became available in April 2015; data for 2014 business patterns will be available in April 2016. Support Using these Resources Learn more about demographic economic data and related analytical tools. Join us in a Data Analytics Web session. There is no fee for these Web sessions. Each informal session is focused on a specific topic. The open structure also provides for Q&A and discussion of application issues of interest to participants. ProximityOne User Group Join the ProximityOne User Group to keep up-to-date with new developments relating to geographic-demographic-economic decision-making information resources. Receive updates and access to tools and resources available only to members. Use this form to join the User Group. There is no fee. Additional Information ProximityOne develops geographic-demographic-economic data and analytical tools and helps organizations knit together and use diverse data in a decision-making and analytical framework. We develop custom demographic/economic estimates and projections, develop geographic and geocoded address files, and assist with impact and geospatial analyses. Wide-ranging organizations use our software, data and methodologies to analyze their own data integrated with other data. Follow ProximityOne on Twitter at www.twitter.com/proximityone. Contact ProximityOne (888-364-7656) with questions about data covered in this section or to discuss custom estimates, projections or analyses for your areas of interest. | ||||||||||||||||||||||||||||||||||||
|
|