
|
|
|
.. Interactive Visual Data Analytics (iVDA) Geographic Information Systems (GIS) .. embedded in HTML iframe for interactive use in Web pages A Geographic Information System (GIS) is a computer-based tool that allows users to store, analyze, visualize, and interpret geographic data. Geographic data, also known as spatial or geospatial data, identifies the location of features on earth. GIS combines the visual elements of maps with the ability to link characteristics about those features in datasets. This relationship allows GIS to locate, display, analyze, and model data. GIS technology integrates geographic data with statistical and administrative data using statistical methods and analytics. These abilities make GIS valuable to a wide range of public and private enterprises for explaining events, predicting outcomes and planning strategies. And collaborating on those issues. iVDA is an HTML iframe embedded version of VDA Web GIS Version 4 (VDAW4). iVDA operates with one specified VDAGIS project. Using VDAW4 any available project can be opened/used. VDAW4 offers the opportunity to use the full window screen. When the Web page containing an embedded iVDA iframe is opened, several parameters are set which control the start-up view. See example of the iVDA user interface below -- an interactive mapping application. Many iVDA deployments may be accessed using VDAGIS Discovery. Topics .. Illustrative Application .. Deployments .. Operations .. Terms of Use .. About iVDA iVDA Illustrative Application -- Houston, TX Metro Area .. goto top .. the first thing to do when using iVDA is to have an objective. .. objective: view K-12 Schools as markers in the map view; then know about a school's characteristics. .. the start up view (below) is the Houston, TX metro area. - Metropolitan Statistical Areas (MSAs) are shown with brown bold boundaries. .. show/examine schools .. click the checkbox on the "K-12 Schools Elem" layer in legend panel at left of map. - the map window refreshes showing schools as yellow markers. .. show/examine attributes of a school .. click a school marker in map; profile shows in lower left panel. .. the page being viewed is located at https://proximityone.com/ivda.htm Deployments .. goto top Extensive iVDA applications are available using VDAGIS Discovery which may be accessed/used with any browser on any device. For additional help using iVDA, VDAGIS resources, or geography/subject matter use these resources: .. Contact Us -- send us a question and register for updates using this form. .. Call us -- (888) 364-7656 .. Join us in a Web Session (Tues-Weds-Thurs weekly) - bring your questions Navigation & Operations .. goto top Using iVDA The iVDA frame is a dynamic mapping tool that operates on a VDAGIS project. The iVDA frame structure, user interface, consists of these sections: 01. Toolbar File Zoom Tools 01.1. Layer Editor 01.2. GeoSelect/SiteAnalysis 01.3. SiteAnalysis 01.4. IP Location 01.5. DEDE -- Demographic-Economic Data Explorer Help 02. Searchbar, above the Map Window -- key in address or location and press enter; map view zooms to location 03. Map Window -- displays the layers checked on in the Legend Panel 04. Legend Panel, left of the Map Window -- displays layers available in this VDAGIS project 05. Profile Panel, below Legend Panel -- displays all attributes of an object/shape clicked in Map Window 06. Clipboard button, below Profile Panel -- copies Profile Panel content to clipboard 07. Map Navigation buttons, below Map Window -- Map Window Zoom, drag, zoom to U.S. extent operations 08. Table/Query button, below Map Window at far right -- toggles data table Key Concepts Active Layer The Active Layer is set for each project as a parameter in the iFrame configuration. Clicking in the Map Window selects a shape/object of the Active Layer. For example, if a county layer is the active layer, clicking in the Map Window will select that specific county, zoom to its geographic extent and display a profile of its attributes in the lower left panel. Change the Active Layer by clicking in the Layer name in the Legend Panel. For example, change the active layer to the Places layer in the Legend Panel (click the layer name, it turns blue). .. now press enter in the searchbar (same 85258 value) .. a blue marker showing the location shows in the map. .. what's new .. the map view zooms to the "geographic extent" of the active layer shape containing the location. .. in this case, that is 1) a place and 2) Scottsdale, AZ. .. now you can click the marker, or anywhere in the city to show/use the demographic profile in the lower left panel. 01. Toolbar Operations .. goto navigation & operations topics 01.1. Layer Editor .. goto navigation & operations topics Use this feature to modify the appearance of a layer that is shown the legend panel. Click on a layer name (making it the active layer) .. it turns blue. Click Tools>Layer Editor to start the Layer Editor; the Editor form opens as shown below. In this example, .. no alternate name is shown (that edit box is left blank). .. the transparency ("see through level") is set to 50%. .. a field is selected to display as a label for each geographic object in map window. .. the position of the label relative to the geographic object is selected. .. the label background and font colors are selected. .. the polygon outline color and width are selected. Click Set & Close button to apply the selected settings in map window. .. the form closes and settings are applied as shown in the map window. 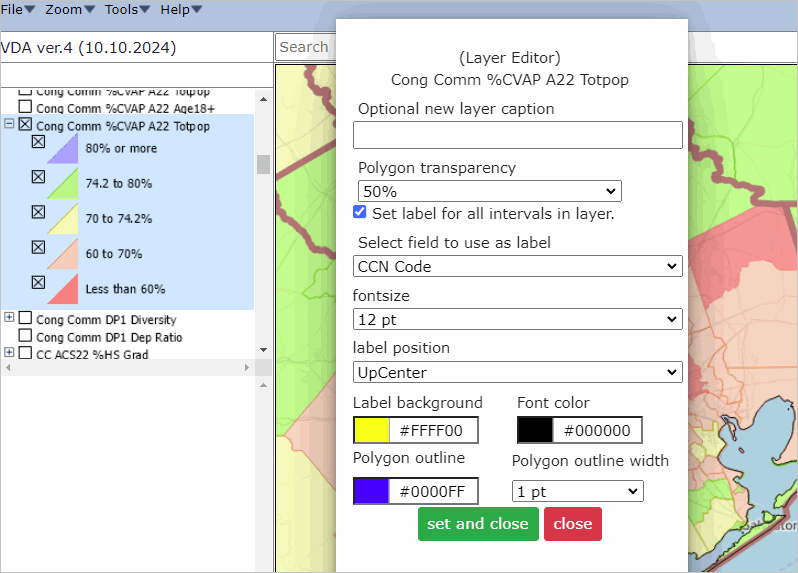 Using the Layer Editor Query Feature .. an example using the Layer Editor Query Feature with the Base project and block group layer .. make the BlkGroups layer active. .. start Tools>Layer Editor .. in the layer editor form enter this query: select geoid,100*unempA22/clfa22 where 100*unempA22/clfa22>20 .. show block groups where the unemployment rate is greater that 20%. 01.2. GeoSelect/SiteAnalysis (visual analysis, iterative site definition) .. goto navigation & operations topics Use this feature to to create profiles for grouped geographies and perform site analysis operations. Click on a layer name (making it the active layer) .. it turns blue. Click Tools>GeoSelect to start the process; the GeoSelset form opens as shown below. In this example, 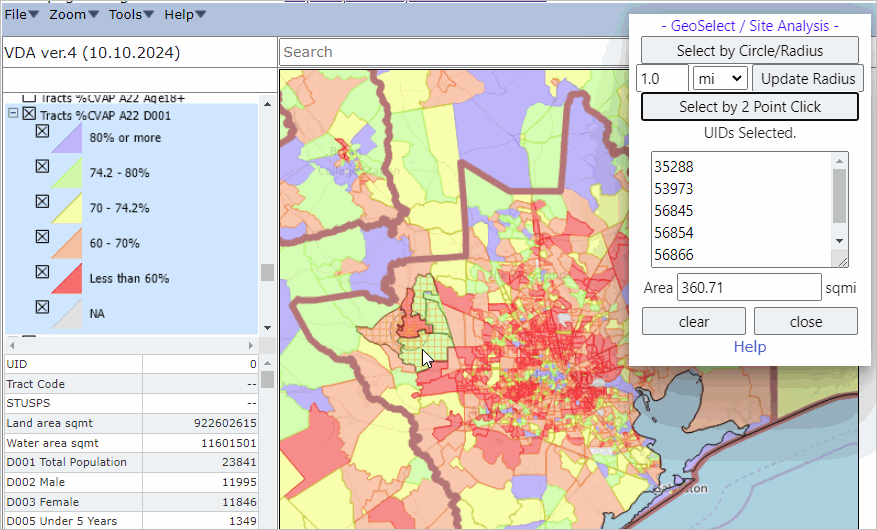
01.3. Site Analysis (circular areas, latitude-longitude, batch processing) .. goto navigation & operations topics Use this feature to to create site (circular) profiles to group latitude-longitude and perform site analysis operations. Click on a layer name (making it the active layer) .. it turns blue. .. in this example, the Base project is used with the "CA Blocks Boundary" is used. In the following example, we will determine that within a 2 mile radius (the site) based on a centroid point of Irvine, CA (33.6845,-117.8264) there are a set of Census 2020 census blocks that changed population from Census 2020 of 38,247 to the 2024 units of 37,983. 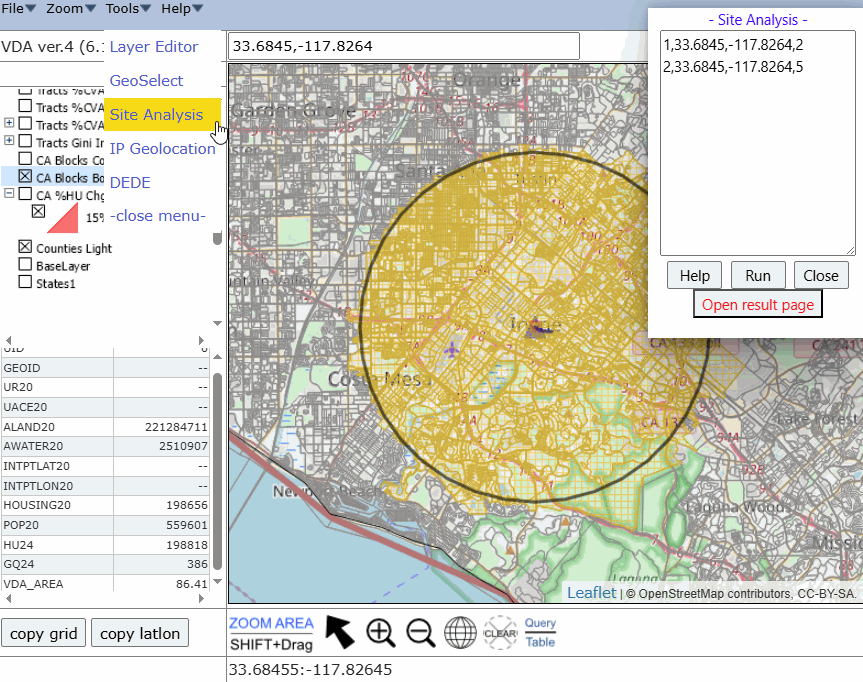 Click Tools>SiteAnalysis to start the process; the form opens as shown below. Start: 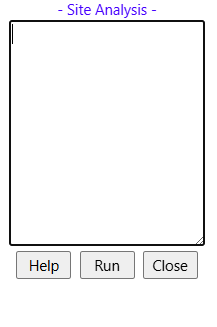 Add site analysis circle attributes .. paste one line per site: .. each line requires 5 comma-delimited items: .. ID .. 1 .. latitude of circle (site) centroid .. 33.6845 .. longitude of circle (site) centroid .. -117.8264 .. circle radius in miles; integer or float .. 2 Add as many sites as desired; possibly copied from file. 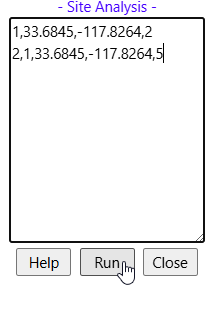 Click Run; processing occurs and form now shows "Open result page": 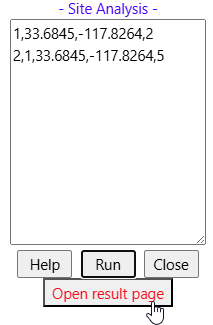 Clicking the open results button, the data are shown .. one line for each site: 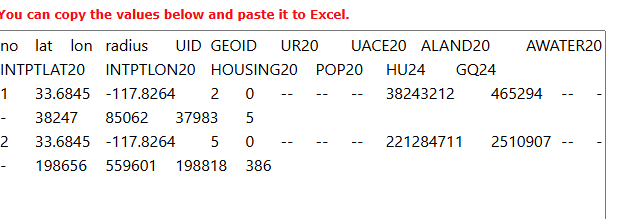 Pasting the copied results in Excel, the final data are shown for this set of sites:  To recap, we have determined that within a 2 mile radius (the site) based on a centroid point of Irvine, CA (33.6845,-117.8264) there are a set of Census 2020 census blocks that changed population from Census 2020 of 38,247 to the 2024 units of 37,983. Note that the map window does not change 01.4. IP GeoLocation .. goto navigation & operations topics Returns approximate location of your Internet Protocol Server 01.5. DEDE -- Demographic-Economic Data Explorer .. goto navigation & operations topics Not active in iVDA. Use VDA Desktop and the DBTools feature. 02. Search Tool .. goto navigation & operations topics Location: above Map Window Action: Search for an address or location in the searchbar. To illustrate, key in 85258 press Enter. .. a blue marker showing the location shows in the map. .. the map view zooms to the "geographic extent" of the active layer shape containing the location. .. in this case, that is 1) a county and 2) Maricopa County, AZ. .. it also show the attributes in a profile in the lower left panel. 03. Map Window & Navigation .. goto navigation & operations topics The Map Window shows the view of the layers checked on in the legend panel. 04. Legend Panel .. goto navigation & operations topics Location: left of the Map Window Action: displays layers available in this VDAGIS project 05. Profile Panel .. goto navigation & operations topics Location: below Legend Panel Action: displays all attributes of an object/shape clicked in Map Window 06. Clipboard button .. goto navigation & operations topics Location: below Profile Panel Action: copies Profile Panel content to clipboard 07. Map Navigation buttons .. goto navigation & operations topics Location: below Map Window Action: Map Window Zoom, drag, zoom to U.S. extent operations 08. Table/Query Operations .. goto navigation & operations topics Location: below Map Window -- rightmost button Action: splits map screen, showing table/grid of selected layer Terms of Use .. goto top There is no warranty regarding any aspect of this using iVDA. The user is solely responsible for any use made of iVDA or data contained in iVDA operations. About iVDA & VDAGIS .. goto top iVDA is an HTML iframe embedded version of VDA Web GIS. VDAGIS tools and data have been developed and are updated/supported by Warren Glimpse/ProximityOne/Alexandria, VA USA and Takashi Hamilton/Tsukasa/Osaka, Japan. Support Using these Resources .. goto top Learn more about census tract demographic economic data and related analytical tools. Join us in a Data Analytics Lab session. There is no fee for these informal sessions focused on your interests. The open structure provides for Q&A and discussion of application issues of interest to participants. Additional Information .. goto top ProximityOne develops geographic-demographic-economic data and analytical tools and helps organizations knit together and use diverse data in a decision-making and analytical framework. We develop custom demographic/economic estimates and projections, develop geographic and geocoded address files, and assist with impact and geospatial analyses. Wide-ranging organizations use our tools (software, data, methodologies) to analyze their own data integrated with other data. Contact ProximityOne (888-364-7656) with questions about data covered in this section or to discuss custom estimates, projections or analyses for your areas of interest. | ||||
|
|