
|
|
|
Metropolitan Area Building Permits
November 2014 Update. Privately-owned housing units authorized by building permits in November were at a seasonally adjusted annual rate of 1,035,000. This is 5.2 percent (+/- 4%) below the revised October rate of 1,092,000 and is 0.2 percent (+/- 1.8%) below the November 2013 estimate of 1,037,000. Single-family authorizations in November were at a rate of 639,000; this is 1.2 percent (+/- 4%) below the revised October figure of 647,000. Authorizations of units in buildings with five units or more were at a rate of 367,000 in November. Building permit data are economic "leading indicators." Important strengths of building permits data include very recent/current data with a very short time lag between the data accessibility and the reference date (November building permit data are available in December). Geographic coverage is another strength. The data are available with standardized definitions for the U.S. by state, metro, county and city. The building permits monthly time series enables analysts to examine trends and can provide insights into business cycles, upturns and downturns. It may take four months to establish an underlying trend for building permit authorizations, five months for total starts and six months for total completions. The Achilles heel of building permits is that they are neither housing starts or completions. Housing starts and completions data are not available with the same geographic granularity as building permits nor do they have the same recent estimates and monthly time series features of building permits. Use the interactive ranking table in this section to view, query, rank, compare building permit data by metropolitan area. Data are provided in the interactive table by month for January 2014 forward (through November, most recent month available). Earlier data are not available for the current vintage (Feb. 2013) metropolitan areas. Visual Analysis of Building Permits by Metropolitan Area This view shows the November 2014 total building permits per 1,000 housing units (2013 estimate) by Metropolitan Statistical Area (MSA). 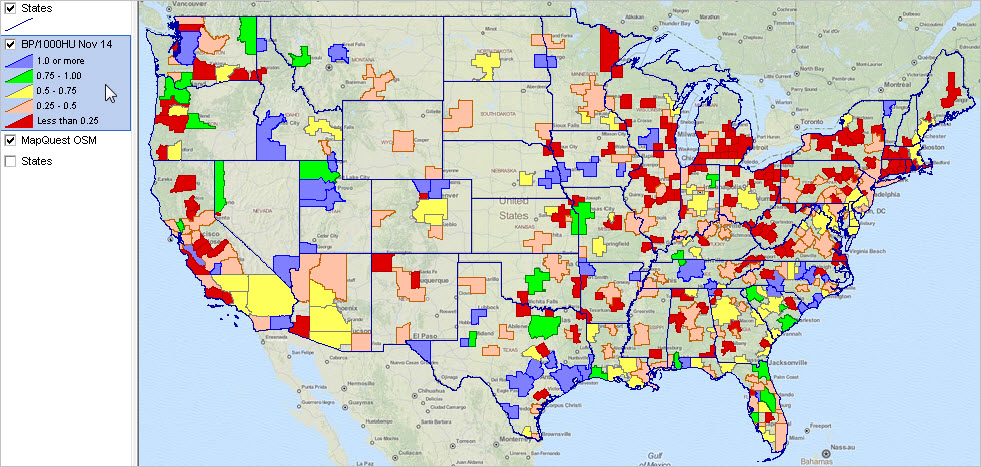 View created with CV XE GIS. Click graphic for larger view. Metropolitan Area Building Permits GIS Project Use the U.S. by Metropolitan Area Building Permits GIS project to create thematic pattern views similar to the one shown above. Zoom-in to any metro/region. Add your own data; change colors, labeling, subject matter used for pattern analysis. See details below in this section. Building Permits in MetroDynamics Metro Profiles and Database Building permit data are updated monthly and are a part of the MetroDynamics Database and Information System. View the MetroDynamics Metro Profiles that show building permits data contextually with other geographic, demographic, economic and business data. Click a metro link in column 2 of the metro interactive table to view a Metro Profile for a metro of interest. The building permits section is populated only for Metropolitan Statistical Areas. Examples: Houston ... Los Angeles ... San Francisco ... Atlanta. Building Permits by Metropolitan Area -- Interactive Table Click ShowAll button between Find/Queries. Use mouseover on column header to view column description. See ranking table usage notes below ranking table. See related ranking tables -- http://proximityone.com/rankingtables.htm. Usage Notes • Click ShowAll button between specific area queries. Creating Map Pattern Views & Visual Analysis (requires Windows computer with Internet connection) 1. Install the ProximityOne CV XE GIS ... run the CV XE GIS installer ... take all defaults during installation 2. Download the U.S. by Metro Building Permits GIS project fileset ... requires ProximityOne User Group ID (join now, no fee) ... unzip U.S. by Metro Building Permits GIS project files to local folder c:\bp 3. Open the c:\bp\bp1.gis project ... after completing the above steps, click File>Open>Dialog ... open the file named c:\bp\bp1.gis 4. Done. The start-up view is similar to the graphic shown at the top of this section. About these Data Data on construction authorized by building permits are based upon reports submitted by local building permit officials in response to a mail survey. They are obtained using Form C-404, "Report of Building or Zoning Permits Issued and Local Public Construction." Single Family Houses - Includes all detached one-family houses. Also includes all attached one-family houses separated by a wall that extends from ground to roof with no common heating system or interstructural public utilities. Includes prefabricated, sectionalized, panelized, and modular homes which are manufactured partially off-site, but which are transported and assembled at the construction site. Excludes mobile homes. Two-Family Buildings - Includes all buildings containing two housing units which may be one above the other or side-by-side. If built side-by-side, they (1) do not have a wall that extends from ground to roof or (2) share a heating system, or (3) have interstructural public utilities such as water supply/sewage disposal. Three- and Four-Family Buildings - Includes all buildings containing three or four housing units. If built side-by-side, they (1) do not have a wall that extends from ground to roof, or (2) share a heating system, or (3) have interstructural public utilities such as water supply/sewage disposal. Five-or-More Family Buildings - Includes all buildings containing five or more housing units. If built side-by-side, they (1) do not have a wall that extends from ground to roof, or (2) share a heating system, or (3) have interstructural public utilities such as water supply/sewage disposal. Support Using these Resources Learn more about demographic economic data and related analytical tools. Join us in a Decision-Making Information Web session. There is no fee for these one-hour Web sessions. Each informal session is focused on a specific topic. The open structure also provides for Q&A and discussion of application issues of interest to participants. ProximityOne User Group Join the ProximityOne User Group to keep up-to-date with new developments relating to geographic-demographic-economic decision-making information resources. Receive updates and access to tools and resources available only to members. Use this form to join the User Group. There is no fee. Additional Information ProximityOne develops geographic-demographic-economic data and analytical tools and helps organizations knit together and use diverse data in a decision-making and analytical framework. We develop custom demographic/economic estimates and projections, develop geographic and geocoded address files, and assist with impact and geospatial analyses. Wide-ranging organizations use our tools (software, data, methodologies) to analyze their own data integrated with other data. Follow ProximityOne on Twitter at www.twitter.com/proximityone. Contact ProximityOne (888-364-7656) with questions about data covered in this section or to discuss custom estimates, projections or analyses for your areas of interest. |
|
|