
|
|
|
|
Business Data Analytics -- tools, data & methods to reach goals and objectives
Business Data Analytics can help any business more effectively reach goals and objectives. Whether a new or established business, serving a county or national market, similar tools and methods apply. • How can you examine patterns/characteristics of existing customers? • Where are prospective customers and possible unknown opportunities? • How do you best define your market area? - what geographies have the largest number of prospects? • What are the sales potential in this market area? - what are the best measures to examine sales potential? • What is your competitive position? - how many other establishments offer a similar service in your market area? • How can your sales data identify geographic areas of opportunity? Trader Joe's & Whole Foods This section and associated GIS project and datasets make use of Trader Joe's as the focus business and Whole Foods as a competitor business. These are both fascinating businesses and the analytical framework could have just as easily been Whole Foods as the focus business. These applications are focused on the "supermarkets and other grocery (except convenience) stores" industry (NAICS 445110) but could have been any other industry. We generalize as to methods, data resources and tools where applicable. Apply these methods, data resources and tools to your situation. Business Data Analytics Tools & Resources Business Data Analytics tools, data and methods described here can help answer these questions and facilitate strategic planning. Here are key steps to using Business Data Analytics in your business. These applications make use of a GIS project and data for Trader Joe's stores. Real store location data are used for Traders Joe's and Whole Foods stores. Click link to view graphics. • Business locations • Territories served • Products & Supply Chain • Market characteristics • Customers & Sales • Competitors, Industry & Regional Economy • Areas of Opportunity, Competitive Position & Market Penetration • Composite Analytical Analyses • Related topics Business Locations [goto top] One of the first steps in developing the analytical framework is to geocode your business locations. Using a geocoding tool, each address of each location is processed to determine the latitude-longitude. The latitude-longitude is used to create a shapefile that can be added to a GIS project. During the geocoding process, the census block geocode is added to the location record enabling other types of geospatial processing reviewed later. The U.S. national scope Trader Joe's locations are shown as red markers in the following graphic.  -- view created using CV XE GIS and associated Business Patterns GIS Project -- click graphic for larger showing details. The next graphic shows a zoom-in to the Washington, DC area. This is the start-up view used in the Business Data Analytics GIS Project.  -- view created using CV XE GIS and associated Business Patterns GIS Project -- click graphic for larger showing details. Territories Served [goto top] The next graphic shows a further zoom-in to the Trader Joe's location in Alexandria, VA (red marker by pointer). This view illustrates the addition of the census tracts layer with labels showing the total population; see tracts layer clicked on in the legend panel at left of map window. The map shows three tracts in the vicinity of this store location with population 1,995, 4,774 and 5,351 (Census 2010). Census tracts can be used to define a service area or territory (other options would be census blocks, block groups or ZIP code areas). In these applications, no fixed markets areas are assumed; rather the process illustrates how the market area can be flexibly defined and alternative configurations evaluated. 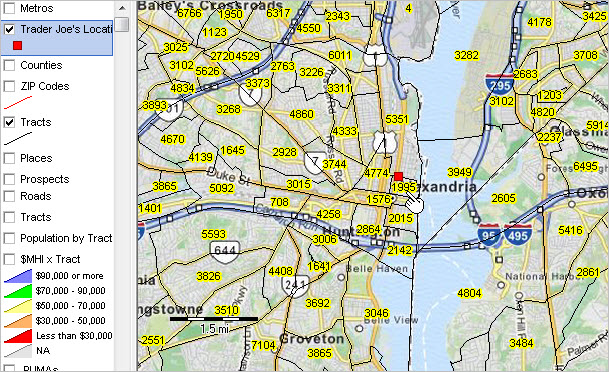 -- view created using CV XE GIS and associated Business Patterns GIS Project -- click graphic for larger showing details. Which census tracts are relevant? Census tracts intersecting a three-mile radius from the store location is shown in the next graphic. This view has been developed with the site analysis tool. There are 53 tracts that have a total population of 181,391. A query was applied to develop this view and data -- only Virginia tracts are included; note that no D.C. nor Maryland tracts are cross-hatched. 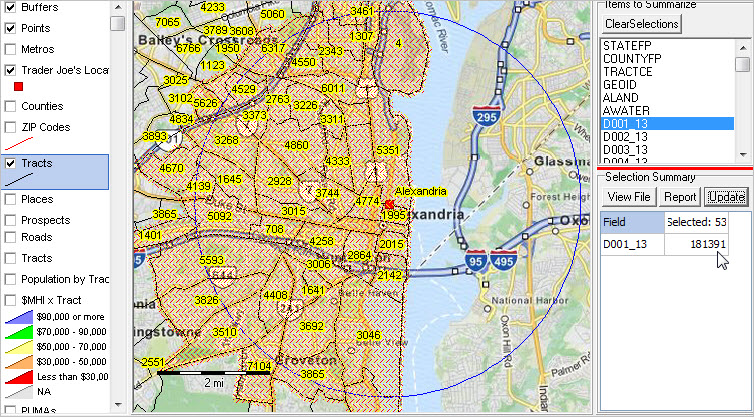 -- view created using CV XE GIS and associated Business Patterns GIS Project -- click graphic for larger showing details. Why use census tracts? Why not use ZIP codes? ZIP code geography can be important when you have customer or sales data where the ZIP code is the only geographic reference. The preferred method is to use the customer, supplier or sales data based on geocodes derived from the full address of the location. ZIP codes are lines, not polygons, and are not defined in terms of latitude-longitude by the U.S. postal service. Approximated ZIP code areas (ZCTAs) are used here and are often associated with much larger areas than census tracts (33,100 ZCTAs compared to 72,565 census tracts. Consider also that ZIP codes typically include both sides of the street. Even if a true USPS ZIP code polygon existed, customer and sales data would be assigned to a ZIP code lying outside the boundary in an adjacent ZIP code area. In the case of census tracts, address geocoded data are assigned to the right side of the street (if done accurately) and thus always inside of the census tract area. Important exceptions. Some summary data are not tabulated by census tract and only available by ZIP code. An example of this are the annually updated ZIP Code business patters data. Use of these data is reviewed in a subsequent section. Products & Supply Chain [goto top] Selected Trader Joe's products are listed in the following scroll section. These products and prices are connected with with sales in related sections.
Market Characteristics [goto top] There are many ways to examine the market characteristics. The following views and subject matter selection illustrate possibilities. Examine wide-ranging demographic-economic characteristics of market areas served. Using these data and tools, it is easy to identify areas having best sales opportunities. Higher Income Households. The following graphic shows patterns of the number of households by tract with a household income of $200,000 or more. The number of households having $200,000 and higher household income intervsls/color correspondence shown in legend at left of the map. Using GIS data and tools, ranges can be customized/shifted to suit. Similarly, the number of households by different income levels can be set. These operations are reviewed/illustrated in the workshop session. 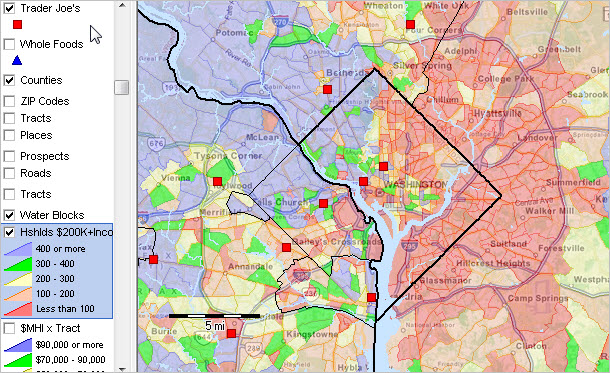 -- view created using CV XE GIS and associated Business Patterns GIS Project -- click graphic for larger showing details. Median Household Income. The following graphic shows patterns of median household income by tract. The median household income intervsls/color correspondence shown in legend at left of the map. Using GIS data and tools, ranges can be customized/shifted to suit. Similarly, the number of households by different income levels can be set. These operations are reviewed/illustrated in the workshop session. 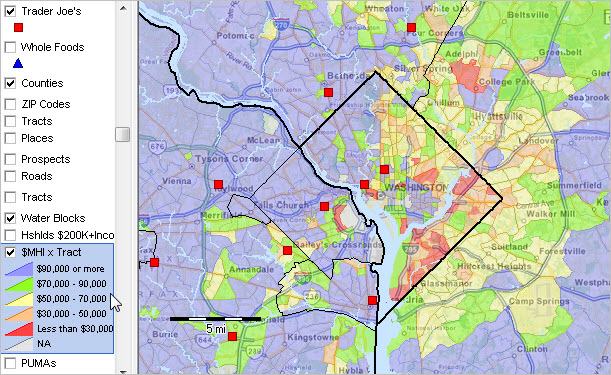 -- view created using CV XE GIS and associated Business Patterns GIS Project -- click graphic for larger showing details. Customers & Sales [goto top] Join us in a Business Data Analytics Workshop to examine these topics and analyses. Competitors, Industry & Regional Economy [goto top] To illustrate relationship to competitors, Trader Joe's locations (red square markers) are shown in relationship to Whole Foods locations (blue triangle markers). 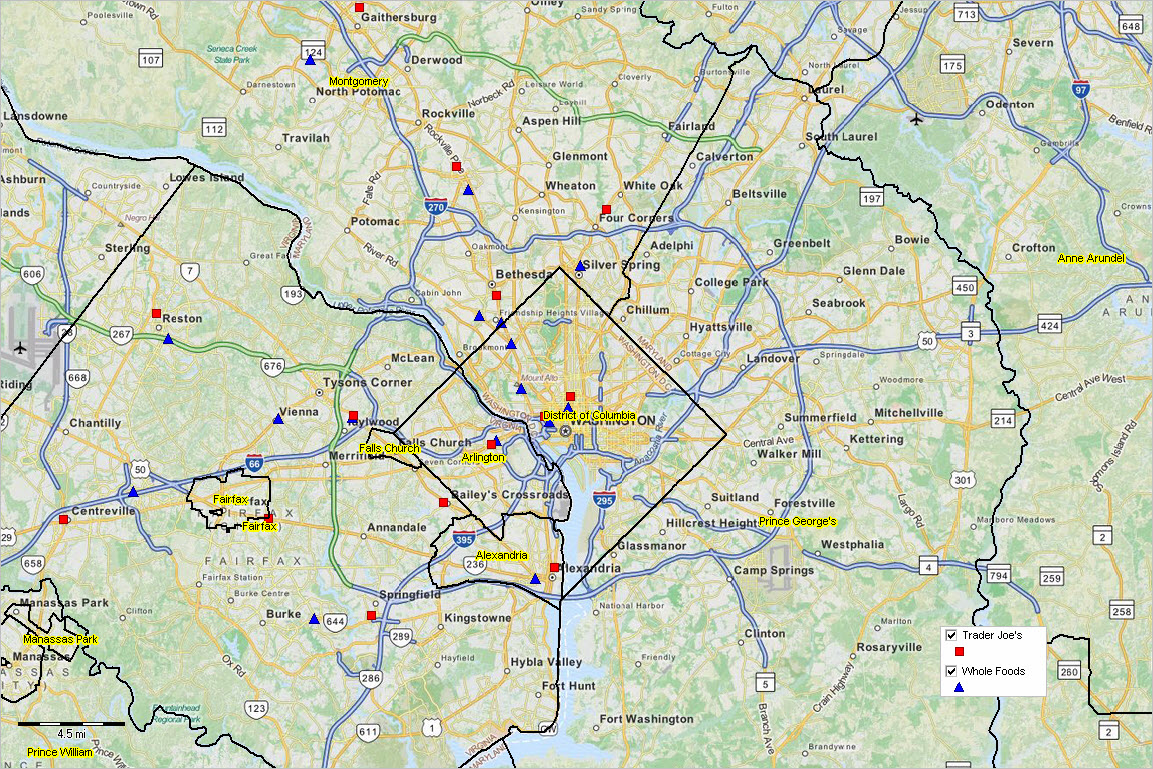 -- view created using CV XE GIS and associated Business Patterns GIS Project -- click graphic for larger showing details. How do the competitive relationships look on a national scale? See the comparison graphics below. Using GIS project and tools, shown the Trader Joe's location above the Whole Foods layer -- or vice-versa. Using the GIS project and tools, zoom into any location. Trader Joe's layer shown above Whole Foods layer  Whole Foods layer shown above Trader Joe's layer 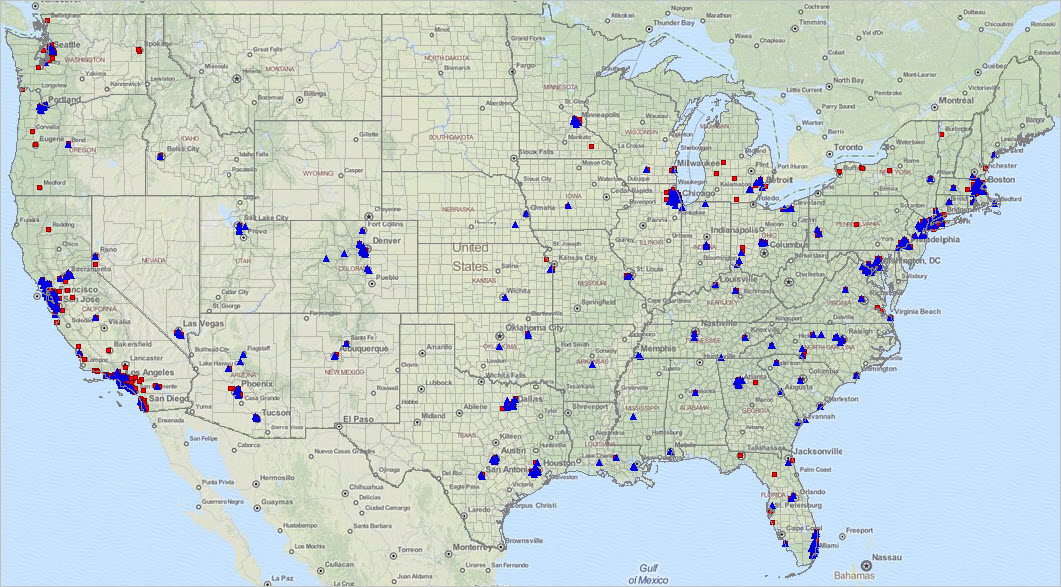 Industry & Economy Characteristics -- Selected Data Resources for Industry Analysis
Join us in a Business Data Analytics Workshop to examine these topics and analyses. Store Locations Relative to All Grocery/445110 Establishments by ZIP Code The following graphic illustrates how the business locations can be examined relative to all establishments in the industry by ZIP code area. Envision a similar application showing your business locations, competitors and summary of all businesses in your industry by ZIP code. ZIP code areas are labeled with the total number of grocery stores (as defined by industry NAICS code 445110 -- "Supermarkets and Other Grocery (except Convenience) Stores") in corresponding ZIP code area. Click graphic for larger view that shows a further zoom-in, with ZIP code labels and more defined ZIP code boundaries. In larger view, ZIP code area 22314 (bottom, near pointer) has 13 NAICS 445110 establishments. These are establishments, not businesses, and thus Safeway locations are counted once even though there might be three Safeway locations.  -- view created using CV XE GIS and associated Business Patterns GIS Project -- click graphic for larger showing details. Areas of Opportunity, Competitive Position & Market Penetration [goto top] Join us in a Business Data Analytics Workshop to examine these topics and analyses. Composite Analytical Analyses [goto top] Join us in a Business Data Analytics Workshop to examine these topics and analyses. Related Topics for Extended Analysis [goto top] These extended topics make use of the data and analyses reviewed above. These topics will be covered in subsequent sections. • Determining performance relative to the market characteristics • Assessing impact of external and internal factors affecting operations - supply chain, labor force, costs, demand ... • Maximizing return on investment • Determining areas of missed opportunity - metros, hot spots within metros • Using collective data in models for predictive analytics - examining how might things change & determining impact: when, where and how • Interpreting statistical releases - determining which relevant, assessing implications for impact • Methods for more effective team/collaborative/management decision-making Support Using these Resources Learn more about demographic economic data and related analytical tools. Join us in a Data Analytics Lab session. There is no fee for these Web sessions. Each informal session is focused on a specific topic. The open structure also provides for Q&A and discussion of application issues of interest to participants. ProximityOne User Group Join the ProximityOne User Group to keep up-to-date with new developments relating to geographic-demographic-economic decision-making information resources. Receive updates and access to tools and resources available only to members. Use this form to join the User Group. Additional Information ProximityOne develops geographic-demographic-economic data and analytical tools and helps organizations knit together and use diverse data in a decision-making and analytical framework. We develop custom demographic/economic estimates and projections, develop geographic and geocoded address files, and assist with impact and geospatial analyses. Wide-ranging organizations use our software, data and methodologies to analyze their own data integrated with other data. Follow ProximityOne on Twitter at www.twitter.com/proximityone. Contact ProximityOne (888-364-7656) with questions about data covered in this section or to discuss custom estimates, projections or analyses for your areas of interest. |
|
|