
|
|
|
-- tools, data & methods -- Alexandria, VA; December 1, 2015 Business Data Analytics can help any business more effectively reach goals and objectives. Whether a new or established business, serving a county or national market, similar tools and methods apply. • How can you examine patterns/characteristics of existing customers? • Where are prospective customers and possible unknown opportunities? • How do you best define your market area? - what geographies have the largest number of prospects? • What are the sales potential in this market area? - what are the best measures to examine sales potential? • What is your competitive position? - how many other establishments offer a similar service in your market area? • How can your sales data identify geographic areas of opportunity? Business Data Analytics tools, data and methods covered in the workshop can help answer these questions and facilitate strategic planning. We cover key steps to help you use Business Data Analytics in your organization. These applications make use of a GIS project and related datasets for a business case study. In the afternoon, we review how to develop similar GIS projects and related datasets from the ground up -- methods and resources that you can use back in your office. We draw on elements developed for the Certificate in Data Analytics Trader Joe's & Whole Foods The workshop uses Trader Joe's as the focus business and Whole Foods as a competitor business. These are both fascinating businesses and the analytical framework could have just as easily been Whole Foods as the focus business. These applications are focused on the "supermarkets and other grocery (except convenience) stores" industry (NAICS 445110) but could have been any other industry. We generalize as to methods, data resources and tools where applicable. Apply these methods, data resources and tools to your situation. Helping Your Business Thrive Join us at the Business Data Analytics Workshop. This document provides an overview and registration information. See more about Business Data Analytics and resources used in this session.
Program This program is designed primarily for business professionals, consultants, analysts seeking to advance data analytics skills in using geographic, demographic, economic and business data and data analytics. Goals associated with use of these data, tools and methods are to identify and improve business opportunities and operations. Each participant receives data access, integration and analytical software and data resources for perpetual post-workshop use. Participants will learn how to use these data and analytical tools. Upon returning the office, participants may continue to use the resources on a perpetual basis. Topics, Data Resources and Tools Topics covered in morning computer hands-on session: • Overview of data and data analytics tools & methods covered • Business locations • Territories served • Products & Supply Chain • Market characteristics • Customers & Sales • Competitors, Industry & Regional Economy • Areas of Opportunity, Competitive Position & Market Penetration • Composite Analytical Analyses • Related topics • Determining performance relative to the market characteristics • Assessing impact of external and internal factors affecting operations - supply chain, labor force, costs, demand ... • Maximizing return on investment • Determining areas of missed opportunity - metros, hot spots within metros • Using collective data in models for predictive analytics - examining how might things change & determining impact: when, where and how • Interpreting statistical releases - determining which relevant, assessing implications for impact • Methods for more effective team/collaborative/management decision-making Benefit & What You Get • Face to face time with Warren Glimpse, working on your topics • Knowledge development, augmenting analytical skills and results • CV XE GIS software - for your post-workshop use • DEDE API software - for your post-workshop use • BDA GIS Project & Datasets - for your post-workshop use Data Analytics Tools & Data Resources (covered in morning session) The program makes use of the GIS project and software described below. The GIS project and software are not demos. They are production resources and most datasets cover the U.S. Terms of use. Data and software are provided for your use only. The software nor data may be redistributed. Application results (maps, graphics, tables, etc.) may be used in stories, reports and similar documents including publication on the Web. All usage should show reference use of ProximityOne resources and include a link to this Web page. Participants may optionally use these resources to: • become familiar with the data, tools and operations in advance of the session. • follow-along with operations discussed in the presentation using these data/tools on their own laptop. • develop GIS project variations focused on different districts/areas. Installation of the resources requires Windows computer and Internet connection. 1. Install the ProximityOne CV XE GIS. See related User Guide. ... if you already have CV XE GIS on your computer, skip this step and proceed with item 2. ... run the CV XE GIS installer ... take all defaults during installation 2. Download the Business Data Analytics GIS project fileset ... requires UserID provided to registrants ... unzip Business Data Analytics GIS project files to local folder c:\bda 3. Open the c:\bda\bda_sd1.gis project ... after completing the above steps, click File>Open>Dialog ... open the file named c:\bda\bda_sd1.gis 4. Done with installation. The start-up view is shown below. ... if the c:\bda\bda_sd1.gis does not work properly, repeat steps starting with item 2. and allow overwrites if prompted. 5. See illustrated steps to use the Business Data Analytics GIS project Business Data Analytics GIS Project Illustrative View [goto top] Business locations and markets served. Territories for service/market areas are shown as color-shaded areas. -- use the tools to add customers, prospects, assess market characteristics, flexibly re-define territories 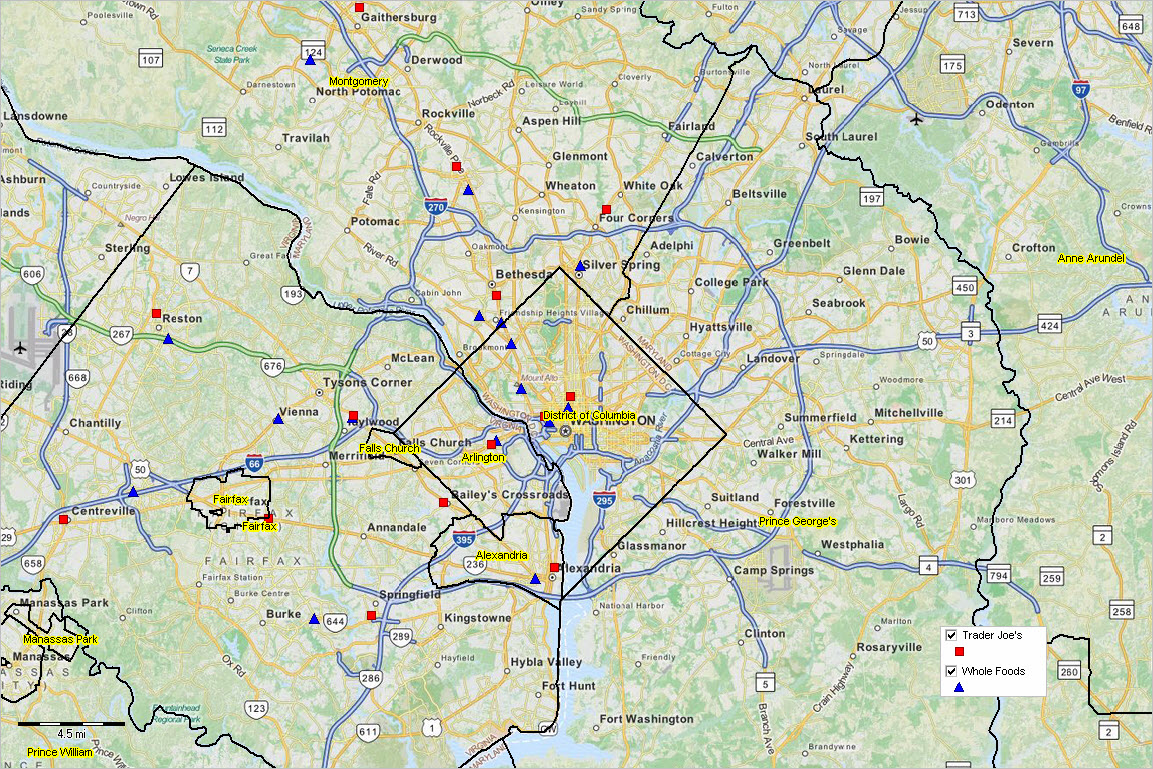 -- view created using CV XE GIS and associated Business Patterns GIS Project -- click graphic for larger showing details. ProximityOne User Group Join the ProximityOne User Group to keep up-to-date with new developments relating to metros and component geography decision-making information resources. Receive updates and access to tools and resources available only to members. Use this form to join the User Group. Support Using these Resources Learn more about accessing and using demographic-economic data and related analytical tools. Join us in a Data Analytics Lab session. There is no fee for these one-hour Web sessions. Each informal session is focused on a specific topic. The open structure also provides for Q&A and discussion of application issues of interest to participants. Additional Information ProximityOne develops geographic-demographic-economic data and analytical tools and helps organizations knit together and use diverse data in a decision-making and analytical framework. We develop custom demographic/economic estimates and projections, develop geographic and geocoded address files, and assist with impact and geospatial analyses. Wide-ranging organizations use our tools (software, data, methodologies) to analyze their own data integrated with other data. Follow ProximityOne on Twitter at www.twitter.com/proximityone. Contact ProximityOne (888-364-7656) with questions about data covered in this section or to discuss custom estimates, projections or analyses for your areas of interest. |
|
|

