
|
|
|
K-12 Schools & School District Data Analytics -- resources to analyze patterns and trends
How to improve K-12 education opportunities and outcomes? How might the K-12 improvements impact your community? Higher education? What resources and methods can be used to better understand where we are ... and where we are going? How can we use data to better understand patterns, where and how change will occur ... and how change will impact us? Have we got the best/right data to answer the right questions? Data Analytics can help K-12 schools, school districts, leadership and stakeholders answer these questions and better achieve visions and goals. This section provides illustrative data analytics views and application examples using a K-12 school district Geographic Information System (GIS) project and related datasets. The McKinney ISD, TX school district, located in the Dallas metro area, is used. A similar data analytics project/fileset can be developed for any school district. The applications use the ProximityOne CV XE GIS software. Most of the files and layers used in the GIS project are described here. Statewide GIS base K-12/community projects/datasets are available for many states; see Missouri The ProximityOne Data Analytics team develops the GIS project and related datasets. The software and data are electronically installed on the school/school district/community computers. Knowledge of how to develop the datasets and GIS project are not required by school/school district staff. Specialized staff are not required to operate the software, use the GIS tools and data or perform data analytics applications. Having staff available with these skill sets can extend productivity and results from use of the resources. McKinney ISD in Context of Counties/Region McKinney ISD shown with bold black boundary. McKinney city shown as hatched area. Urban census blocks: orange fill pattern; understanding urban/rural status of geography important for many reasons. See more about K-12 schools and urban/rural geography.  -- view created using CV XE GIS and associated LAES GIS Project -- click graphic for larger showing details. Zoom-in View of McKinney ISD & K-12 Schools See school by type/level in legend at left of map. View, compare, query, rank K-12 schools of interest using this interactive table. Extensive school level data are integrated and accessible but not shown in these views. 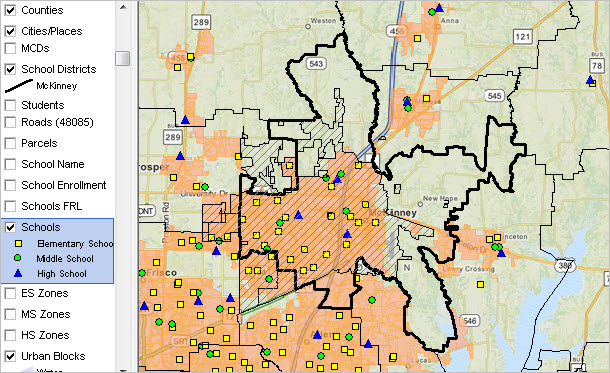 -- click graphic for larger showing details. Students Shown by Red Markers Student markers/locations are added to the GIS project by first geocoding the student address data. A shapefile is created and added to the GIS project. Extensive student level data (demographic, performance, other) are integrated and accessible but not shown in these views. Optionally place a query on the students layer to view/analyze those meeting a certain condition such as attending a specific school, enrolled in a certain grade/grade range, having specified test results, etc. 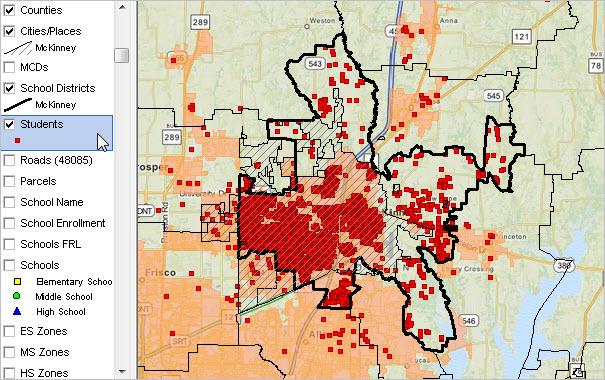 -- click graphic for larger showing details. Elementary School Zones See ES Zone layer (blue boundary) at left in legend panel; choose any/all zones. School zone boundaries can facilitate analysis of students attending associated school. The GIS project can facilitate analysis of alternative redistricting plans and enrollment distributions change. 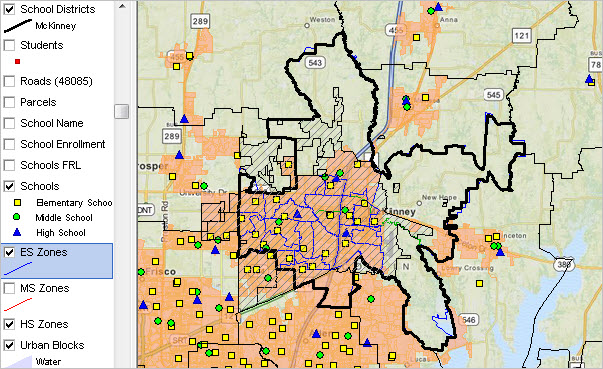 -- click graphic for larger showing details. Further Zoom-in View ES Zones labeled with ES Zone name; census block layer turned off (unchecked). The ability to easily navigate across geography or add detail can create visual pattern analysis not possible using tabular data. 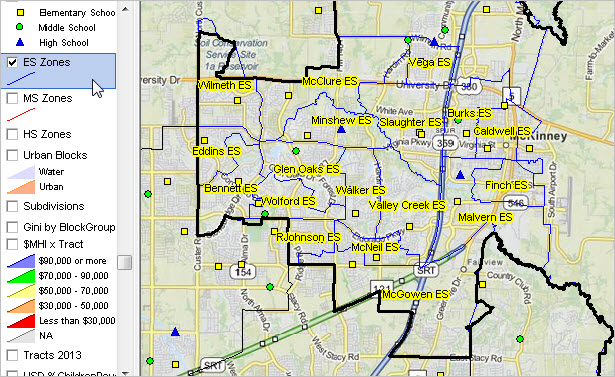 -- click graphic for larger showing details. Using Site Analysis; Focus on Walker ES Zone Using the Site Analysis operation, a query placed on student layer so only students attending this school are shown (red markers). The CV XE Site Analysis tool used to select a small group of students (cross-hatched in circle). See summary in grid at right; total students 51; 5 students are Hispanic. In the grid, the total number of students is shown with the name "Weight" -- the field name of the database item used to dynamically total/sum/count the number of students. In this example, the value of the weight field is always 1 (thus when summed it shows the total number of students). The field could be set to values varying by individual student for a measure such as performance or participation. 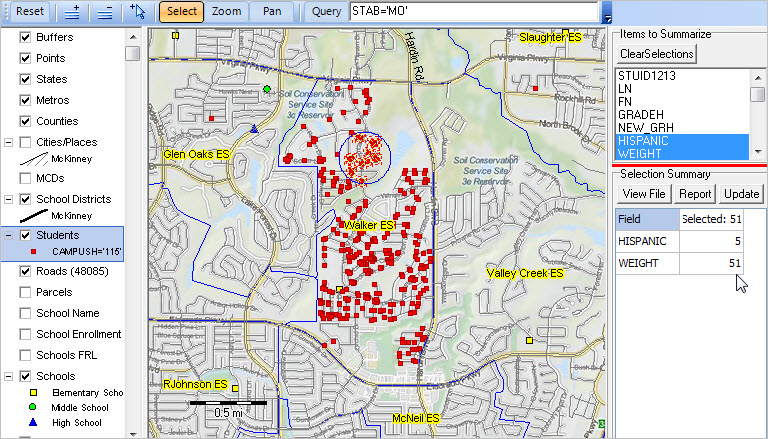 -- click graphic for larger showing details. Using Site Analysis; Focus on Walker ES Zone Counting all students enrolled in Walker ES; 532 students; 69 Hispanic. 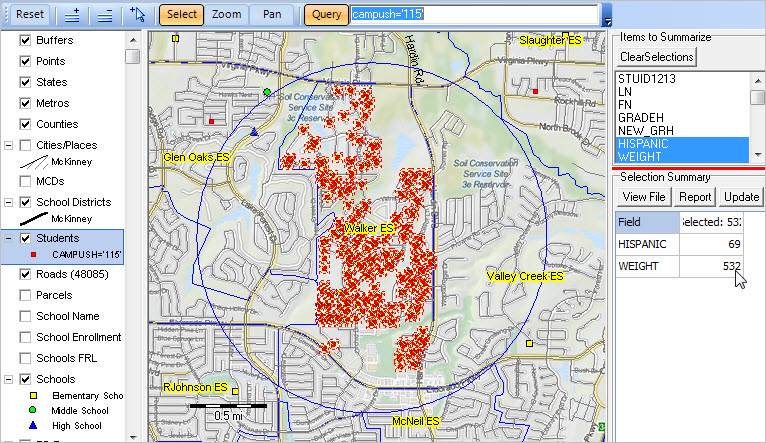 -- click graphic for larger showing details. Using Site Analysis; Focus on Walker ES Zone; Further Zoom-in View This view shows all students; note some are not selected as they are residents of Walker ES zone but do not attend that school. Census block layer has been checked on; census blocks are labeled with Census 2010 population. 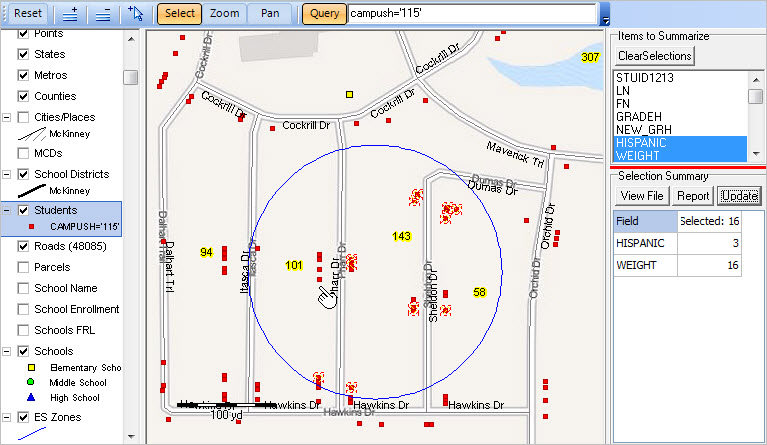 -- click graphic for larger showing details. Thematic Pattern Map; Gini Coefficient by Block Group; McKinney ISD Region Patterns of income inequality as shown by Gini Coefficient by census block group. Block groups are the smallest geography for which richer demographic-economic data are available (from ACS). See more about Gini Coefficient and Income Inequality. 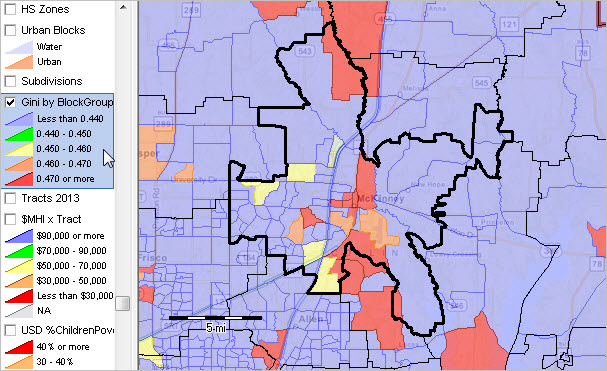 -- click graphic for larger showing legend details. Patterns of Economic Prosperity by Census Tract; McKinney ISD Region View shows Median Household Income by census tract. Approximately 74,000 census tracts, averaging 4,000 population, cover the U.S. wall-to-wall. The graphic shown below illustrates integrating census tract/neighborhood level demographic-economic data from American Community Survey with attributes of students, schools and other geography. 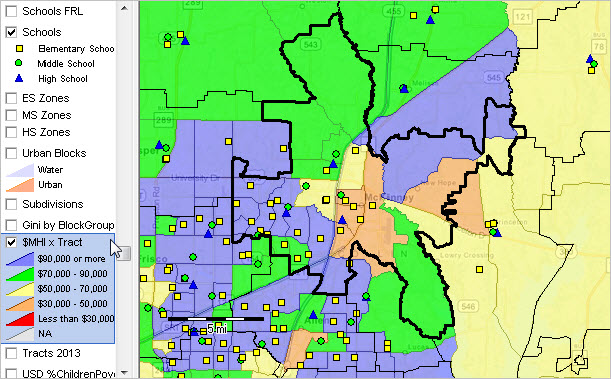 -- click graphic for larger showing legend details. Examining Demographic-Economic Characteristics for a Study Area -- Study Area Part 1 The view below shows use of the Site Analysis tool to select a set of 5 census tracts in the vicinity of McKinney Boyd HS (blue triangle marker). Any number of tracts can be selected, contiguous or otherwise. The subject matter items to be summarized are D001_13 (total population), D002_13 (male) and D002_13 (female) -- ACS 2013 5-year estimates. More or different items could have been selected. The grid at lower right shows aggregated (across 5 tract) values for these three items. 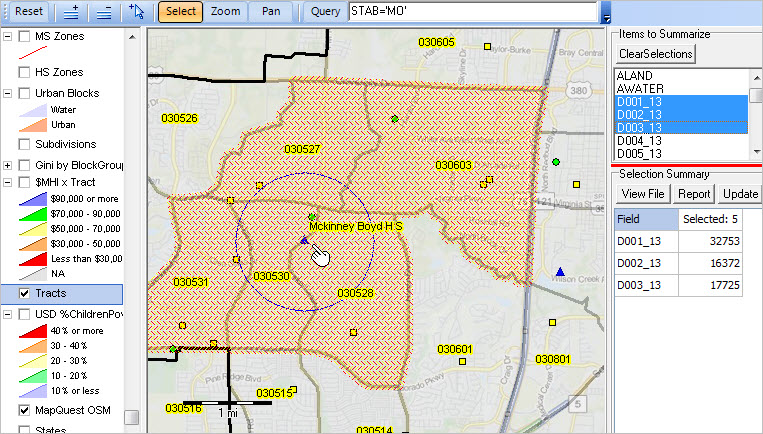 -- click graphic for larger showing legend details. Database Operations -- Export/View Tract Dataset for Study Area -- Study Area Part 2 The view below shows the tracts dataset records in a CV XE grid/spreadsheet based on the above Site Analysis operation. This dataset extract is generated, and grid populated, when the View File button is clicked in the Site Analysis operation (see in Part 1 graphic at right). This grid displays the records selected in the above operation. These selected data records can optionally be exported for use with other software.  -- click graphic for larger showing legend details. Demographic-Economic Profiles for Study Area -- Study Area Part 3 Summary demographic-economic profiles are generated for the above 5 census tract study area by clicking the Report button in the Site Analysis operation (see Part 1 graphic at right). View the McKinney Boyd HS Area 1 Analysis Reports/HTML profiles generated: • General Demographics (DEP1) ... more about these data & national scope interactive table • Social Characteristics (DEP2) ... more about these data & national scope interactive table • Economic Characteristics (DEP3) ... more about these data & national scope interactive table • Housing Characteristics (DEP4) ... more about these data & national scope interactive table Patterns of Percent Children in Poverty by School District; McKinney ISD Region The graphic shown below illustrates using visual analysis tools to compare/contrast school district characteristics in region/state. View, compare, query, rank school districts of interest using this interactive table. Data used in the graphic shown below are derived from the from ACS 2013 5-year estimates. 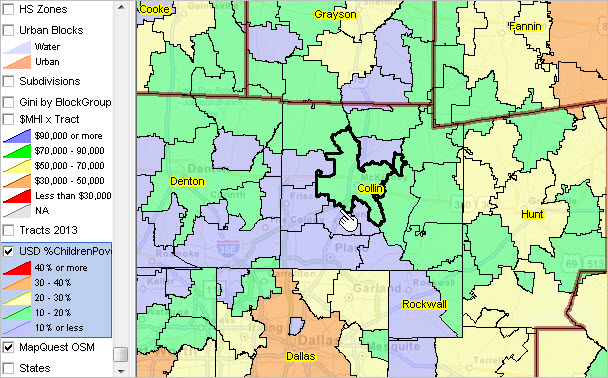 -- click graphic for larger showing legend details. Children's Demographics & Living Environment Most demographic-economic data are developed for the whole population in an area. Data from the annually updated ACS School District Tabulation can help analysts and leadership better understand demographic-economic characteristics of children, and gain insights into needs, in a school district. See the McKinney ISD Children's Demographic-Economic Profile by Universe of Enrollment. Predictive Analytics; Demographic-Economic Projections ProximityOne develops demographic-economic estimates and projections for individual school districts and component area geography such as census tracts. These data help schools and school districts examine how enrollment and the population in the district might change over the next several years. Projections are developed in several ways: by single year of age by gender by race/origin, by type of enrollment (public school, private school, not enrolled), and by demographic-economic characteristics. Roads & the Digital Map Database The street/road network used in the GIS project is from an augmented version of the TIGER digital map database. Each street/road segment runs from intersection to intersection creating opportunities for routing and transportation management. The CV XE GIS identify tool is used to click-on a street segment (see pointer). A mini-profile for this segment is displayed as shown in the graphic. The mini-profile shows that this is the 5500 block of Petunia Dr. 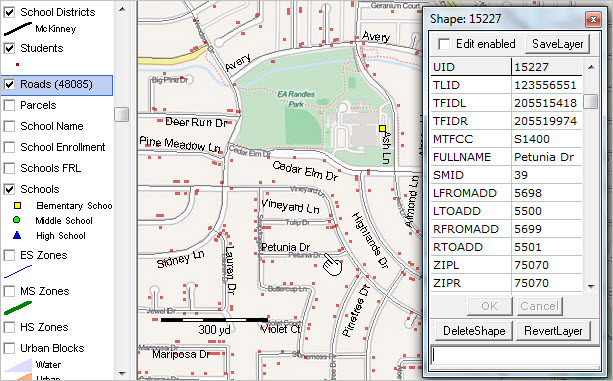 -- click graphic for larger showing legend details. Support Using these Resources Learn more about demographic economic data and related analytical tools. Join us in a Data Analytics Lab session. There is no fee for these Web sessions. Each informal session is focused on a specific topic. The open structure also provides for Q&A and discussion of application issues of interest to participants. ProximityOne User Group Join the ProximityOne User Group to keep up-to-date with new developments relating to geographic-demographic-economic decision-making information resources. Receive updates and access to tools and resources available only to members. Use this form to join the User Group. Additional Information ProximityOne develops geographic-demographic-economic data and analytical tools and helps organizations knit together and use diverse data in a decision-making and analytical framework. We develop custom demographic/economic estimates and projections, develop geographic and geocoded address files, and assist with impact and geospatial analyses. Wide-ranging organizations use our software, data and methodologies to analyze their own data integrated with other data. Follow ProximityOne on Twitter at www.twitter.com/proximityone. Contact ProximityOne (888-364-7656) with questions about data covered in this section or to discuss custom estimates, projections or analyses for your areas of interest. |
|
|